
Figure 2.
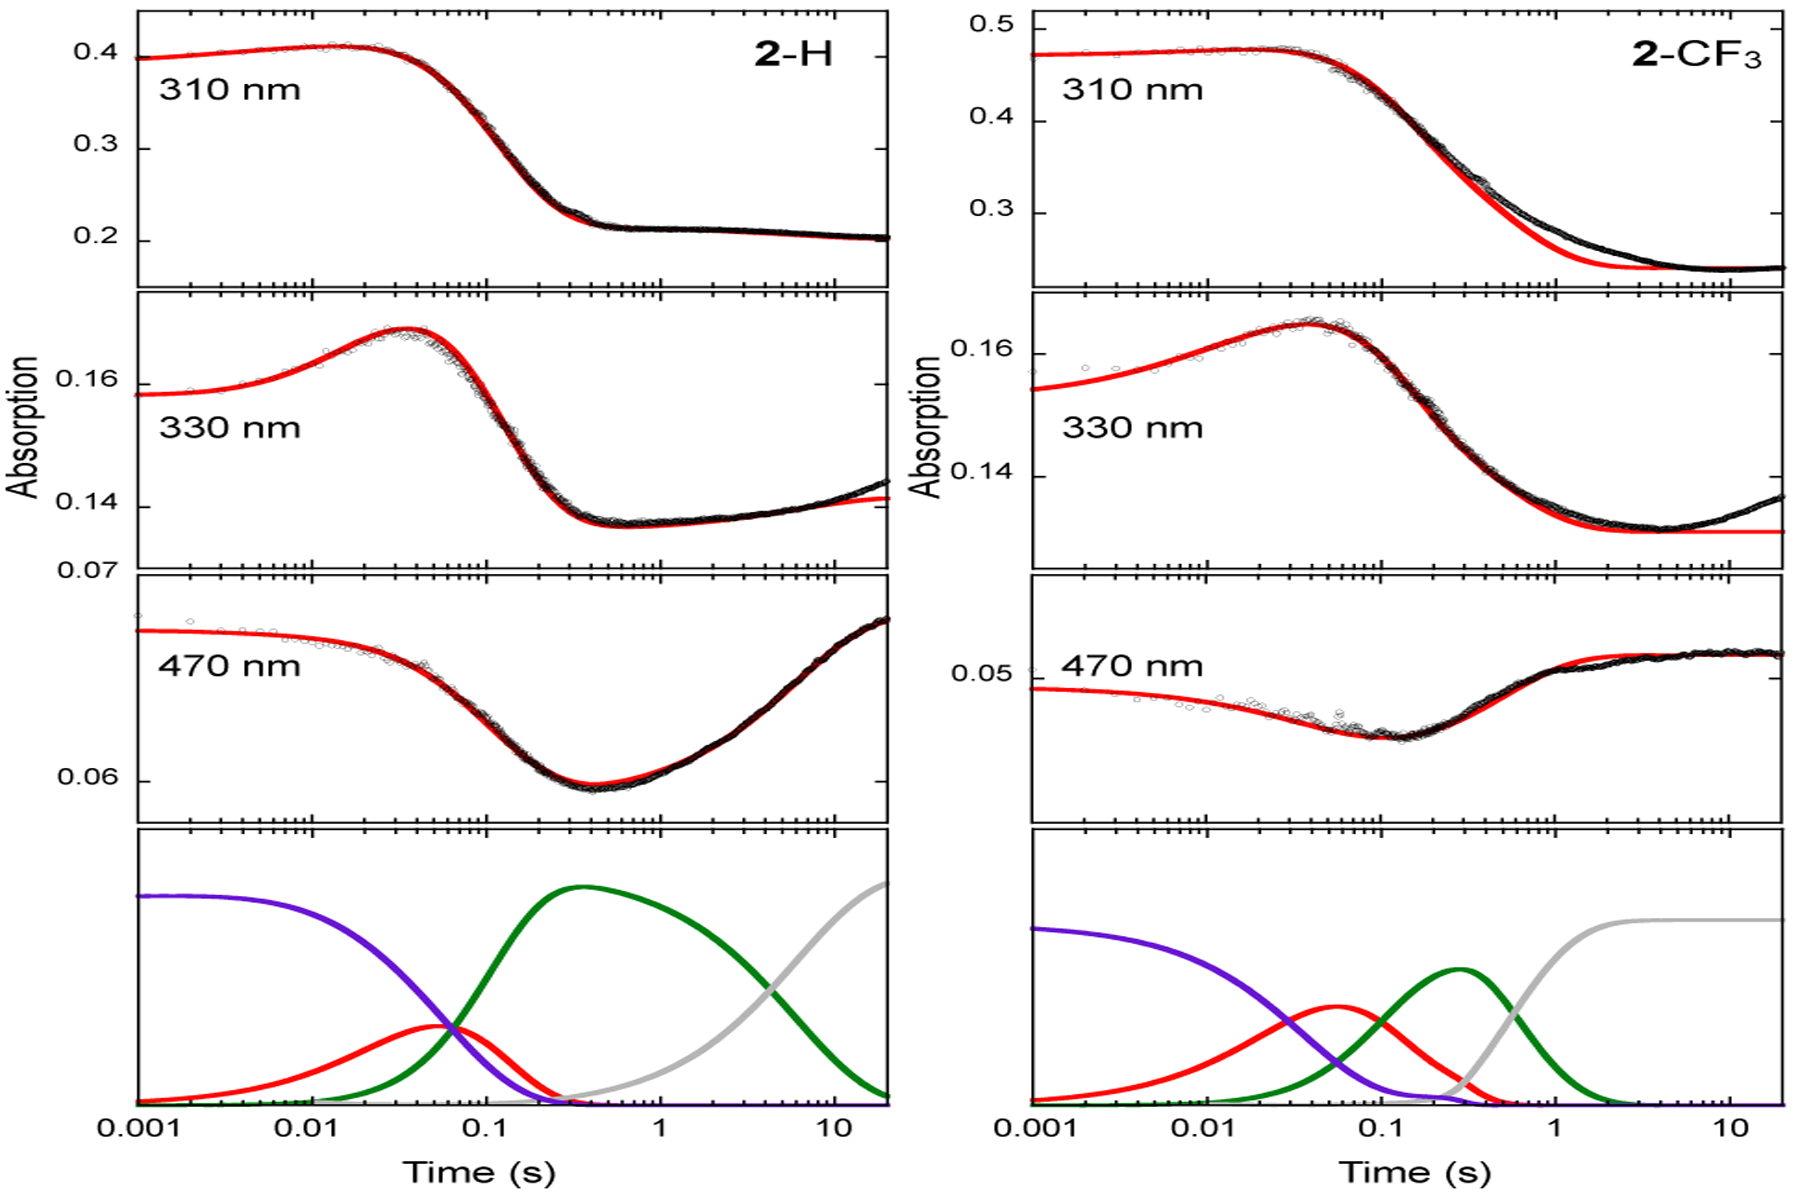
SF-Abs derived kinetic traces of the time-dependent absorption changes at various wavelengths in the AsqJ catalyzed epoxidation by using 2-H (left panel) and 2-CF3 (right panel) as the substrates. Experimental data are shown in black dots, the corresponding kinetic simulations are shown in red curves, and the corresponding rate constants are shown in Table 1. The kinetics of individual species are shown at the bottom of both panels: purple, the AsqJ•Fe2+•2OG•substrate complex; red, the Fe(IV)=O intermediate; green, the AsqJ-Fe2+-succinate-product complex; grey, the AsqJ•Fe2+•2OG complex. The results on the reactions with 2-OMe and 2-F are shown in Figure S5.