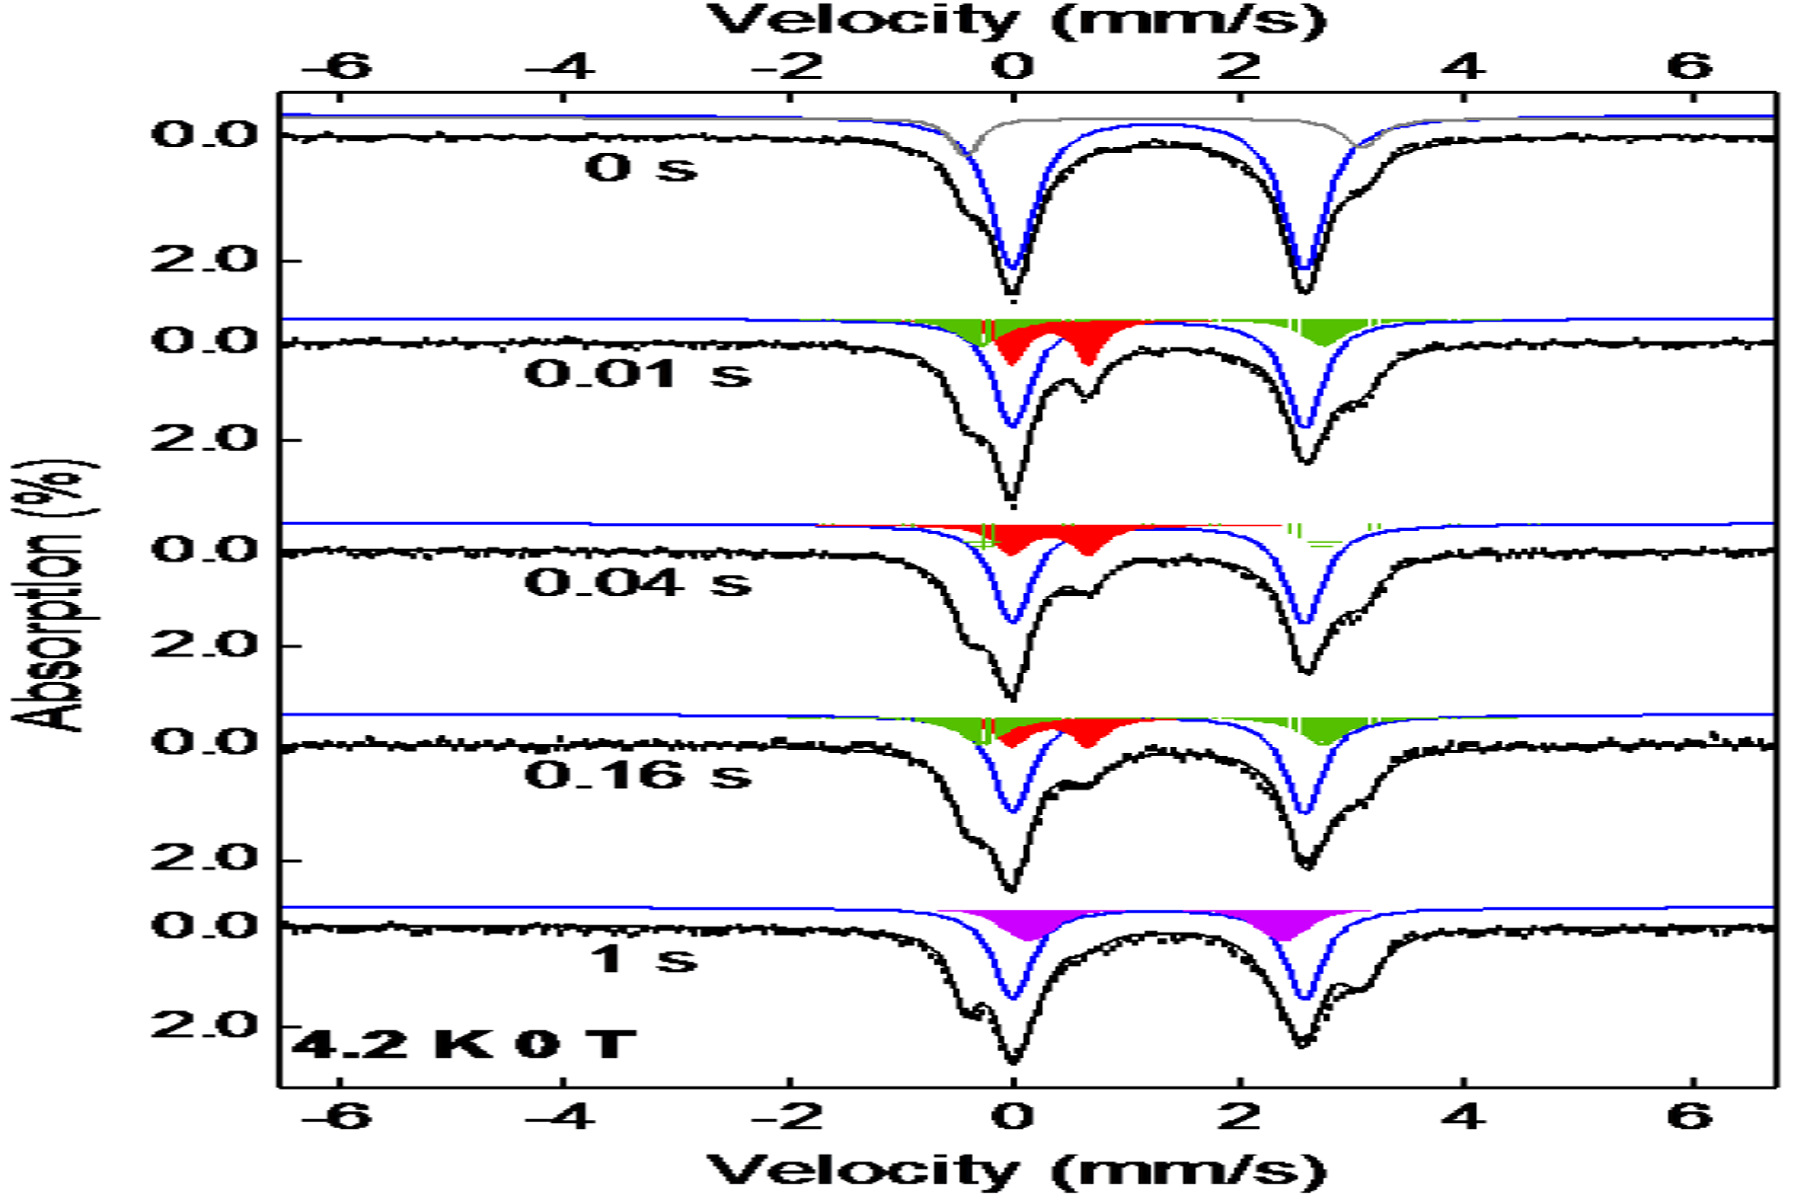
Figure 3.

Zero-field Mössbauer spectra of samples obtained by freeze quenching the reaction of AsqJ with 2-CF3 at various time points. Black vertical bars: experimental data; Black lines: overall spectral simulation; the blue lines: the AsqJ⋅Fe2+⋅2OG⋅2-CF3 complex; the red areas: the Fe(IV)=O intermediate; the green areas: the AsqJ product complex; the purple areas: the AsqJ⋅Fe2+⋅2OG complex; the grey line: the inactive species. The simulation parameters and the relative amount of various species observed in different times are listed in the main text and in Table S2.
