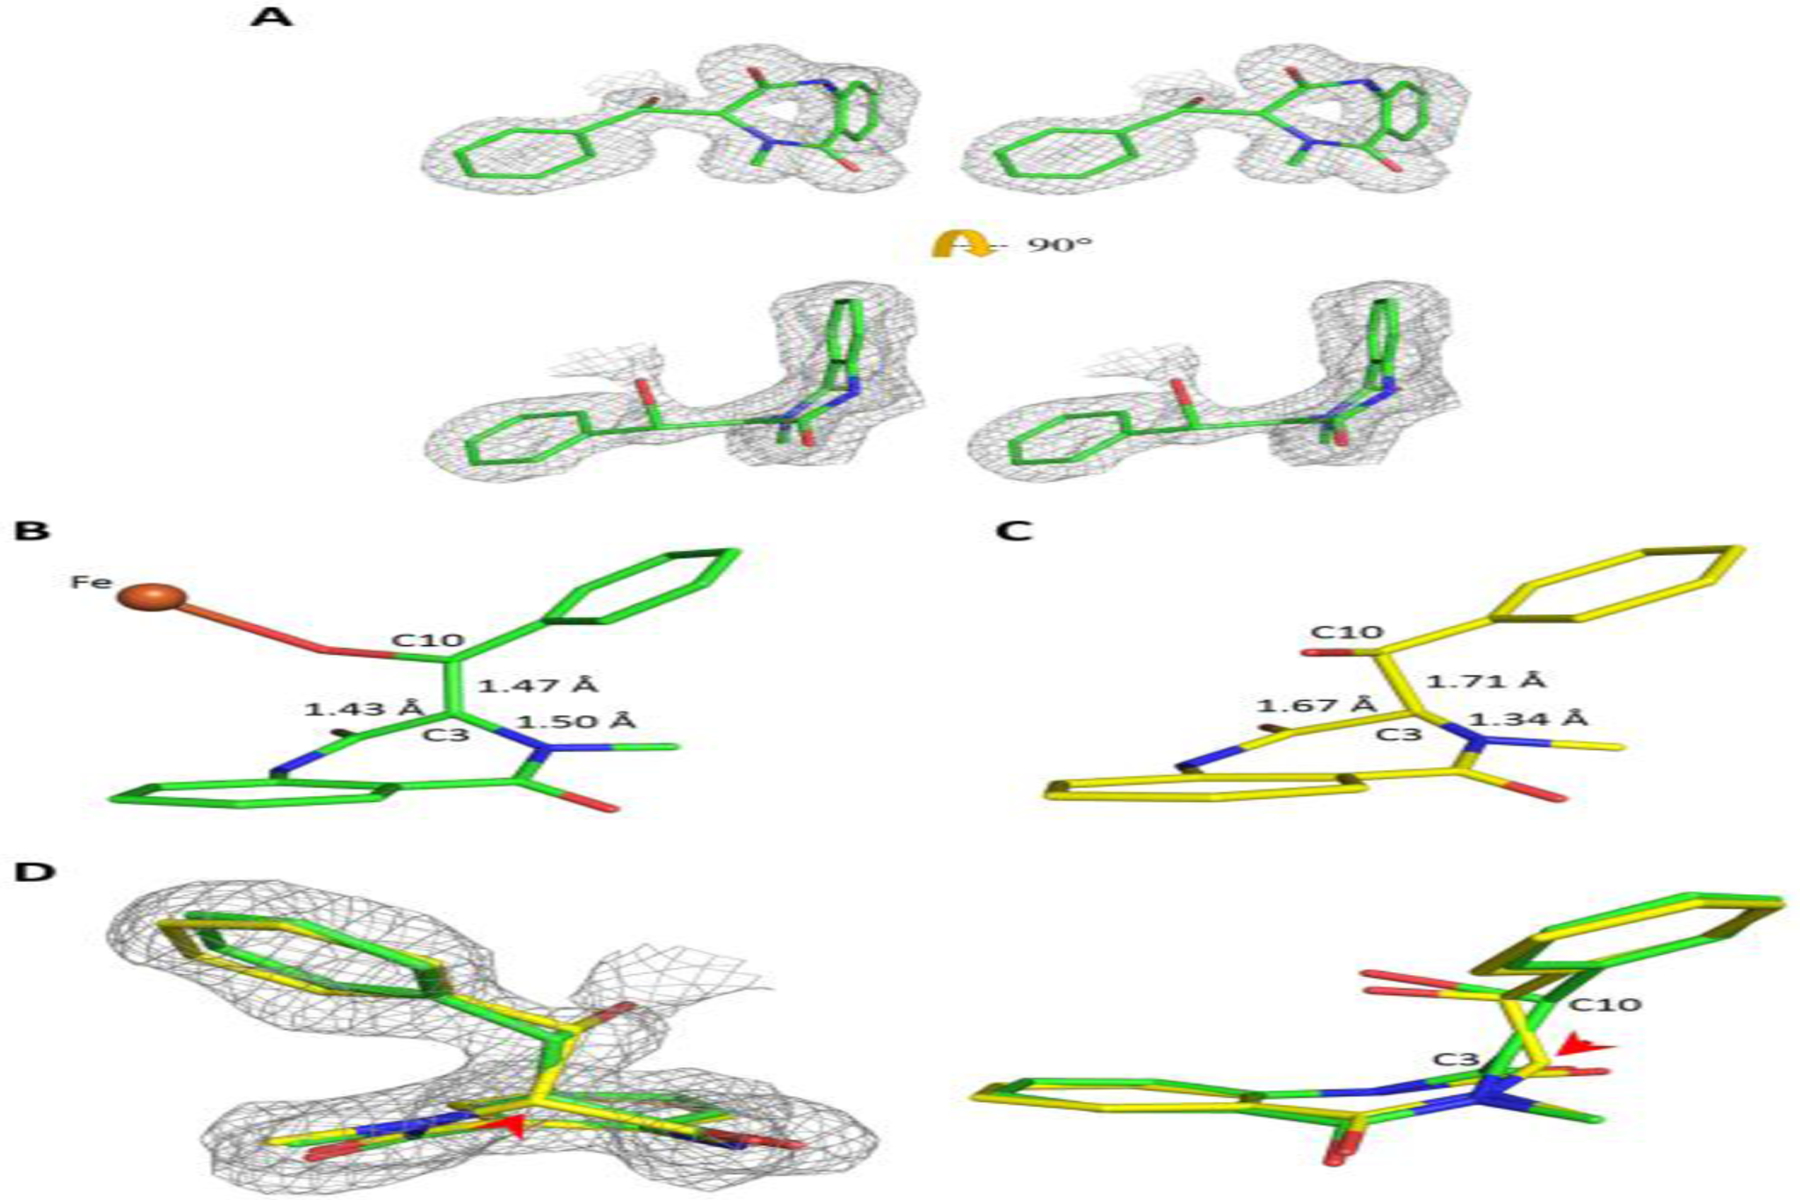
Figure. 6.

A sp2-hybridized C3 of the subtrate following the initial attack on C10 by the ferryl during epoxidation. (A) A wall-eye stereo diagram showing two orthogonal views of the observed epoxidation intermediate structure superimposed on the 2Fo-Fc electron density. (B, C) C3 of the epoxidation intermediate was modeled as sp2 (B, green) or sp3 (C, yellow) for structural refinement. (D) 2Fo-Fc electron density superimposed on the two refined structural models of the epoxidation intermediate with C3 being constrained to either adopt a planar (sp2, green) or tetrahedral (sp3, yellow) geometry. The red arrowhead indicates the position of C3. The 2Fo-Fc electron density maps (contoured at 1.0 σ) are shown in grey mesh. The Fe is shown as an orange sphere. The bound ligands are in stick form with carbon atoms colored either green and yellow, the remaining atoms are colored according to the CPK scheme.
