
Figure 3. LC12 and LC15 are ON-OFF object motion detectors.
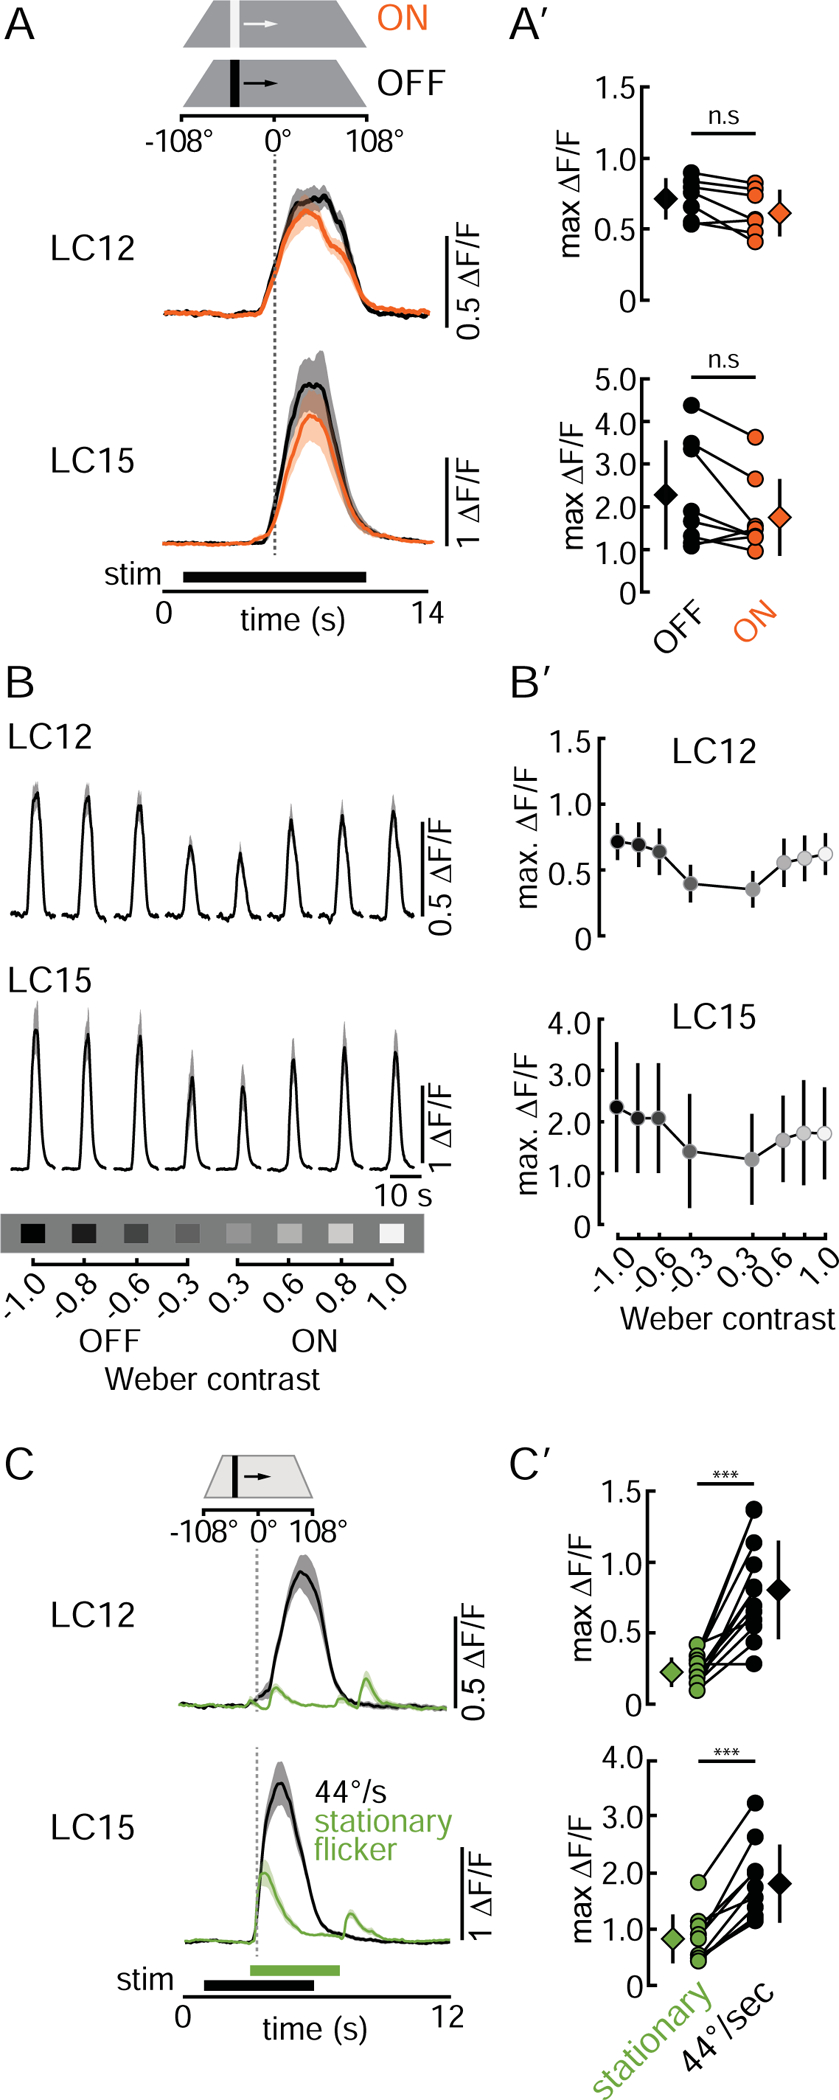
(A) Mean GCaMP6f signals (+/− SD shading) of LC12 and LC15 glomeruli in response to a bright (ON, orange) and dark (OFF, black) bar (8.8×70°, moved at 22°/s). (A’) Pairwise comparison of LC12 and LC15 OFF/ON maximum ΔF/F responses. Circles represent the mean of three repetitions of individual animals, diamonds present the mean across all animals tested +/−SD. n.s. = not significant. LC12: N=7 flies, LC15: N=8 flies. Statistics: paired t-test, LC12: t(6) = 2.74, p = 0.064, LC15: t(7)= 2.15, p = 0.069. (B) Mean GCaMP6f signal of LC12 and LC15 glomeruli in response to varying contrast bars (8.8×70°, 22°/s). (B’) Comparison of LC12 and LC15 contrast selectivity. Fill color of circles represents the bar luminance. Circles represent the mean +/−SD across all animals. LC12: N=7 flies, LC15: N=8 flies. (C) Mean GCaMP6f glomeruli signals in response to an 8.8×70° stationary flickering bar (green) appearing and disappearing at +26° on the display, and the same bar moving with 44°/s (black). LC12: N=12 flies, LC15: N=10 flies. (C’) Pairwise comparison of maximum peak responses of the data shown in (C). Circles represent individual animals, diamonds depict the mean +/−SD. Statistics: paired t-test. LC12: t(11) = 5.97, p = 9.35e-05, LC15: t(9) = 7.47, p = 3.81e-05. See summary in Table S1.