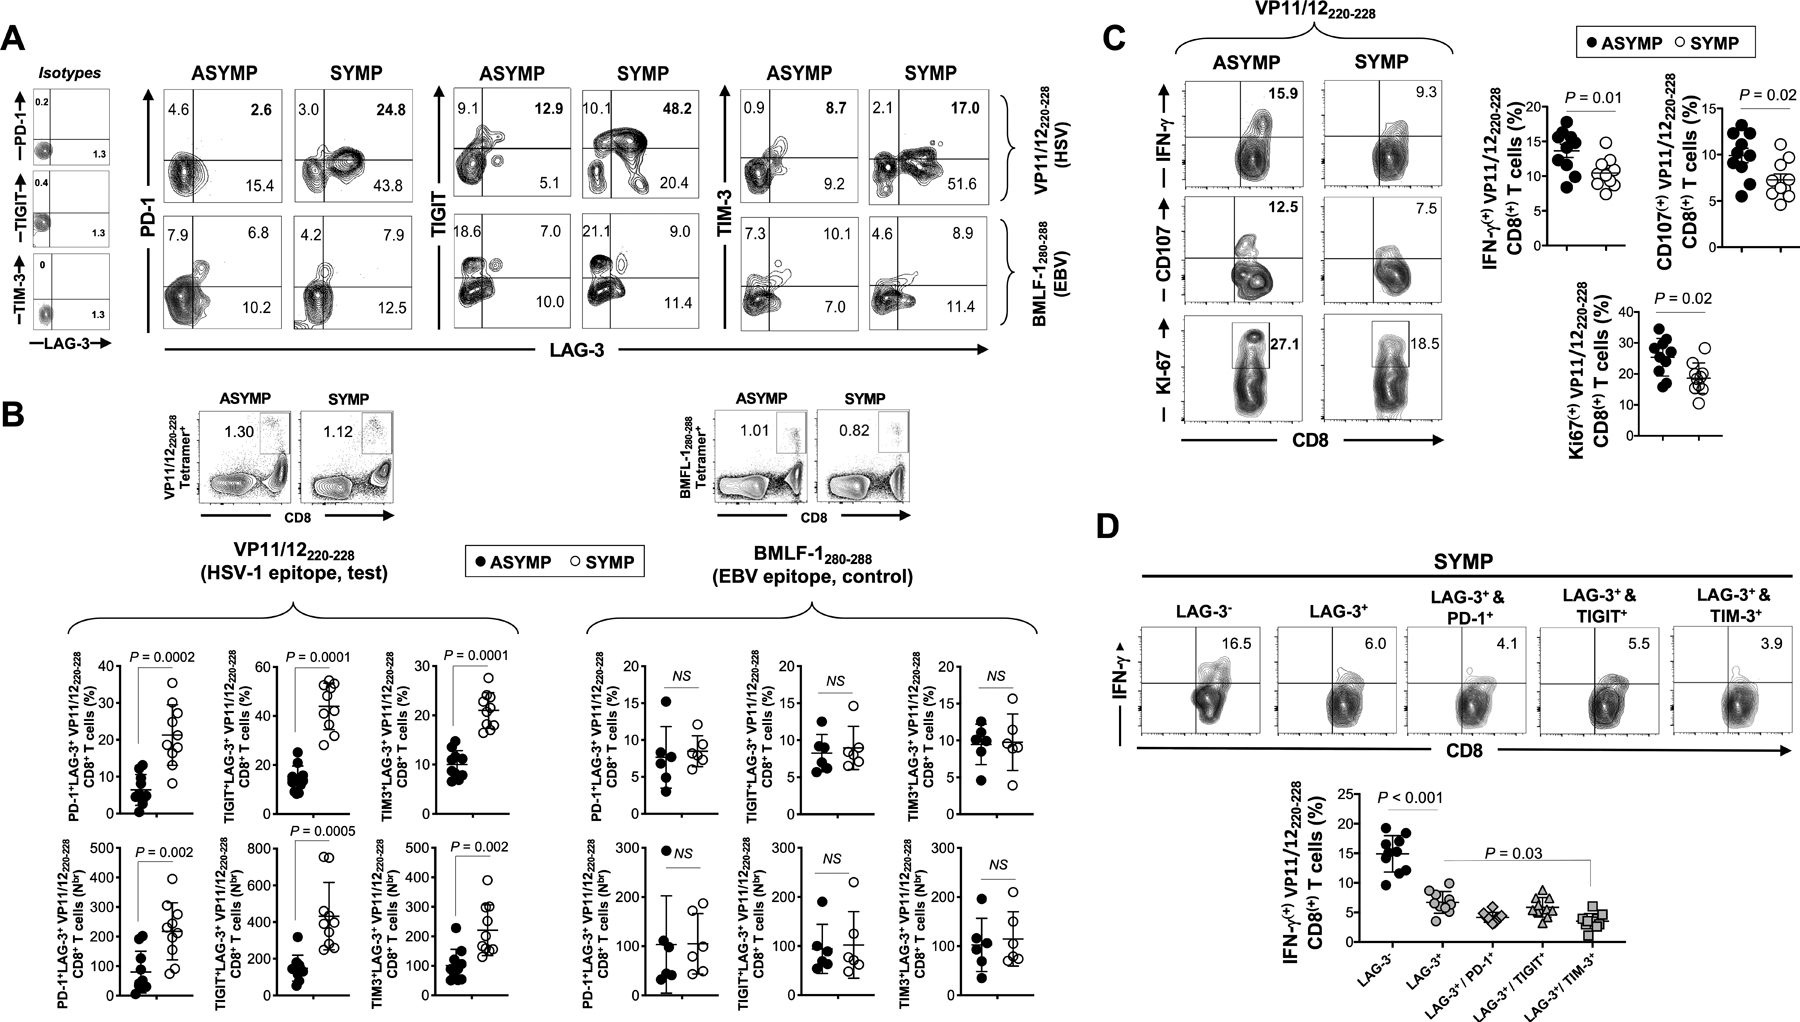
Figure 3: Frequency and function of HSV-1 VP11/12220–228 epitope-specific CD8+ T cells, co-expressing LAG-3 with PD-1, TIGIT and TIM-3 receptors, in SYMP vs. ASYMP individuals.

(A) Representative FACS plots of the frequencies of HSV-1 VP11/12220–228-specific CD8+ T cells (upper row) or control EBV BMFL-1280–288-specific CD8+ T cells (lower row) co-expressing LAG-3/PD-1, LAG-3/TIGIT and LAG-3/TIM-3 in SYMP and ASYMP individuals. On the right: FACS plots representing the isotype controls staining. (B) Average percentages (upper row) and absolute numbers (lower row) of HSV-1 VP11/12220–228-specific CD8+ T cells (left panels) and control EBV BMLF-1280–288-specific CD8+ T cells (right panels) co-expressing LAG-3/PD-1, LAG-3/TIGIT and LAG-3/TIM-3 in SYMP and ASYMP individuals. Representative FACS plots of the HSV-1 (VP11/12220–228) and EBV (BMFL-1280–288) tetramer staining are displayed on the top of each left and right panel, respectively. (C) Representative FACS plots (left panels) and average (right panels) frequencies of functional HSV-1 VP11/12220–228-specific CD8+ T cells expressing IFN-γ, CD107a/b and Ki-67 from SYMP vs. ASYMP individuals. (D) Representative FACS plots (top panels) and average percentages (lower panels) of functional HSV-1 VP11/12220–228-specific IFN-γ+CD8+ T cells gated on the LAG-3–, LAG-3+, LAG-3+/PD-1+, LAG-3+/TIGIT+ and LAG-3+/TIM-3+ T cell populations. Each staining was performed in duplicate. The indicated P values, determined using unpaired t test, compared expression of exhaustion receptors between SYMP and ASYMP individuals (B and C) and between cell populations (D).
