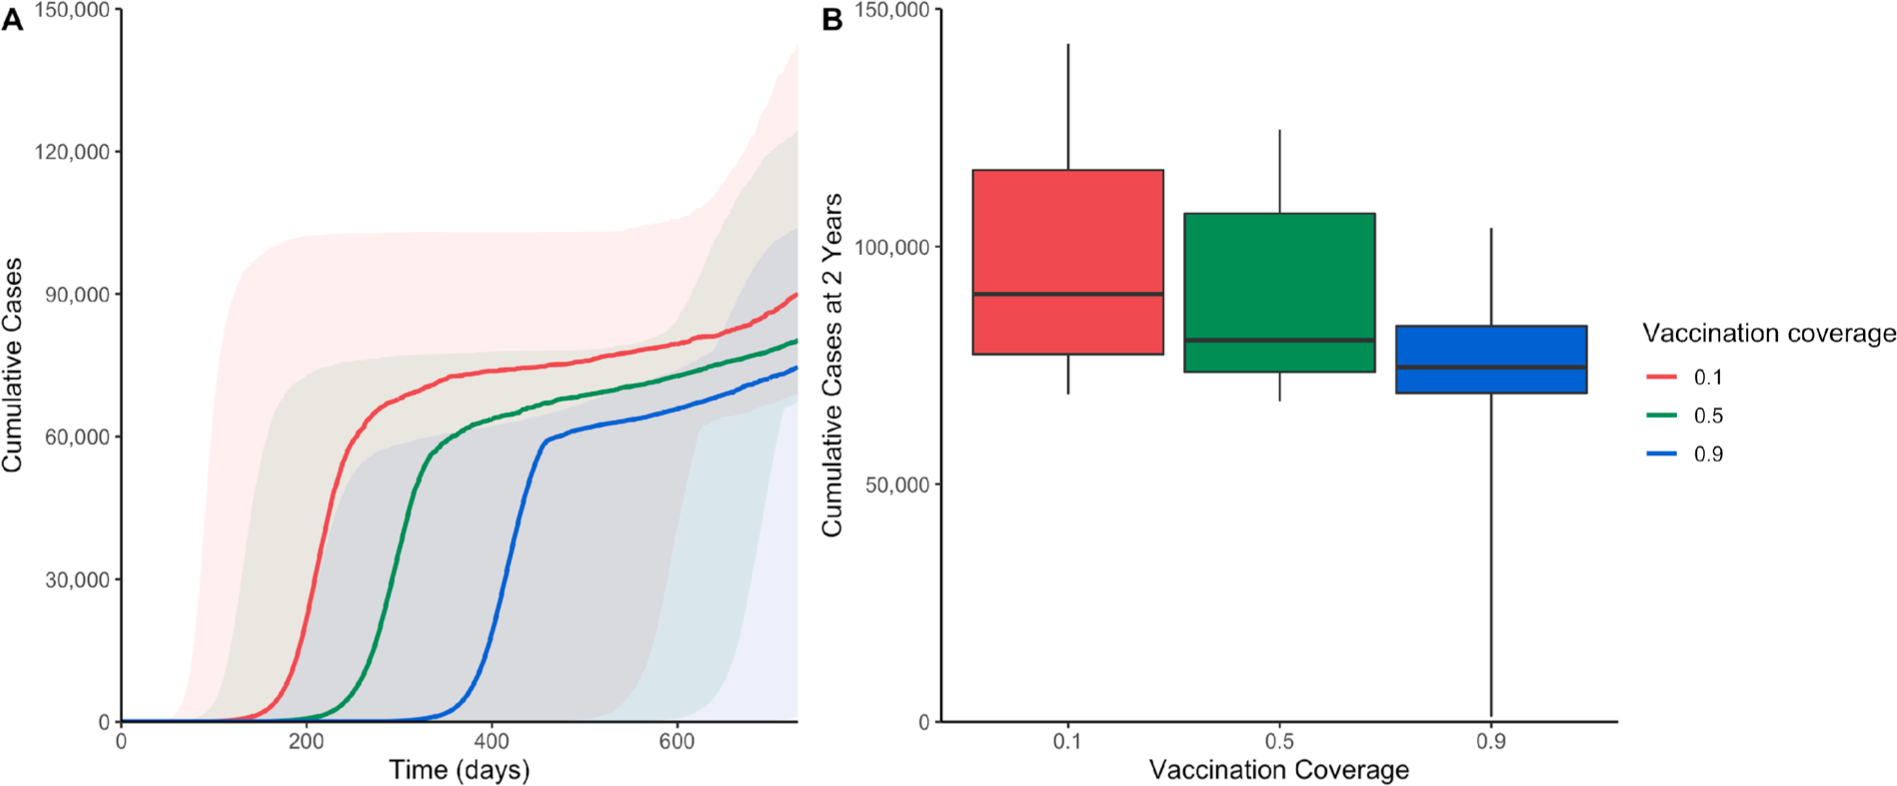
Fig. 4.

(A) Cumulative number of measles cases over time under varying scenarios of vaccination coverage rates. Shaded areas represent the range between estimates’ 10% and 90% percentiles from LHS sampling of 1000 parameter combinations. (B) Boxplots of the cumulative number of measles cases at 2 years (730 days) using 1000 LHS parameter combinations under the same vaccination coverage rate scenarios. Maximum and minimum values represent 90% and 10% percentiles, respectively.
