
Figure 2: Blood Glucose Regulation -.
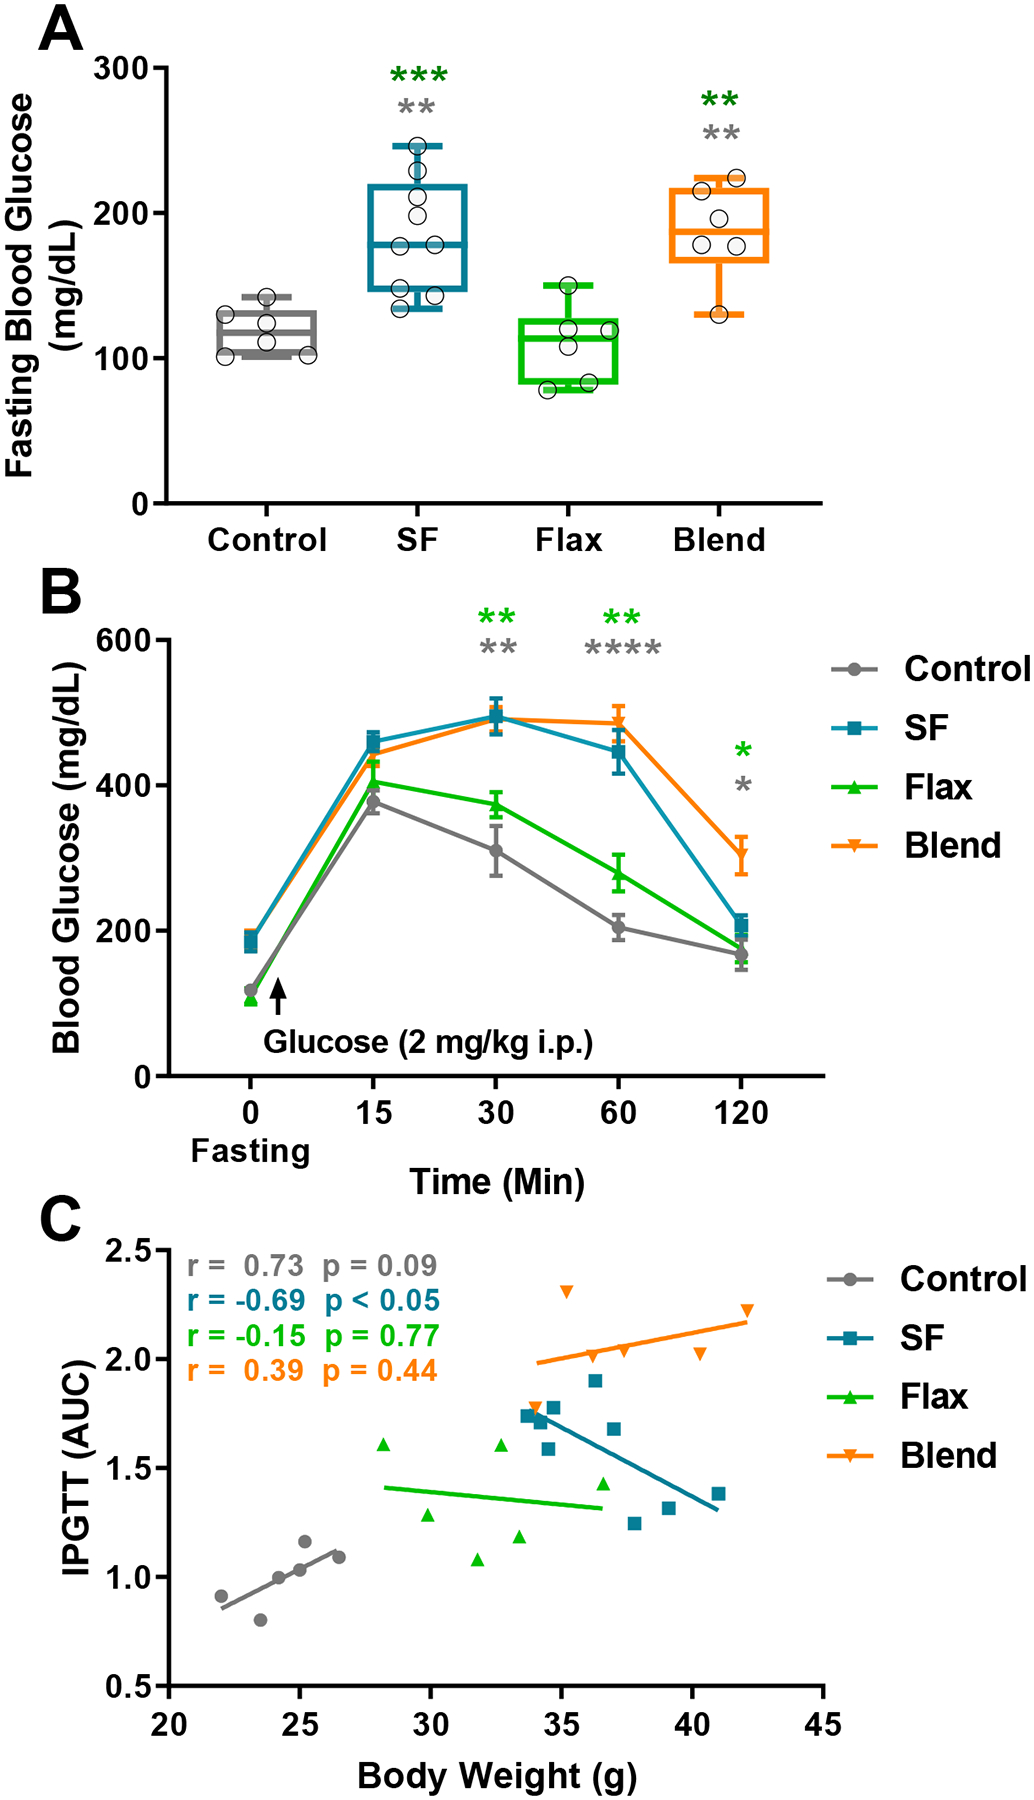
(A) Blood glucose measurements following a 9 hr fast. Box plot represents the median, 25th and 75th percentiles, with the whiskers indicating the minimum and maximum values. (B) Blood glucose values expressed as group mean ± SEM before and after delivery of glucose (2mg/kg i.p.). (C) Correlational analysis of glucose clearance plotted as a function of body weight, with lines representing linear regression analysis within group. Pearson’s r values and corresponding p value are inset in vertical order of treatment group legend. (**, p < 0.01; ***, p < 0.001, ****, p < 0.0001)