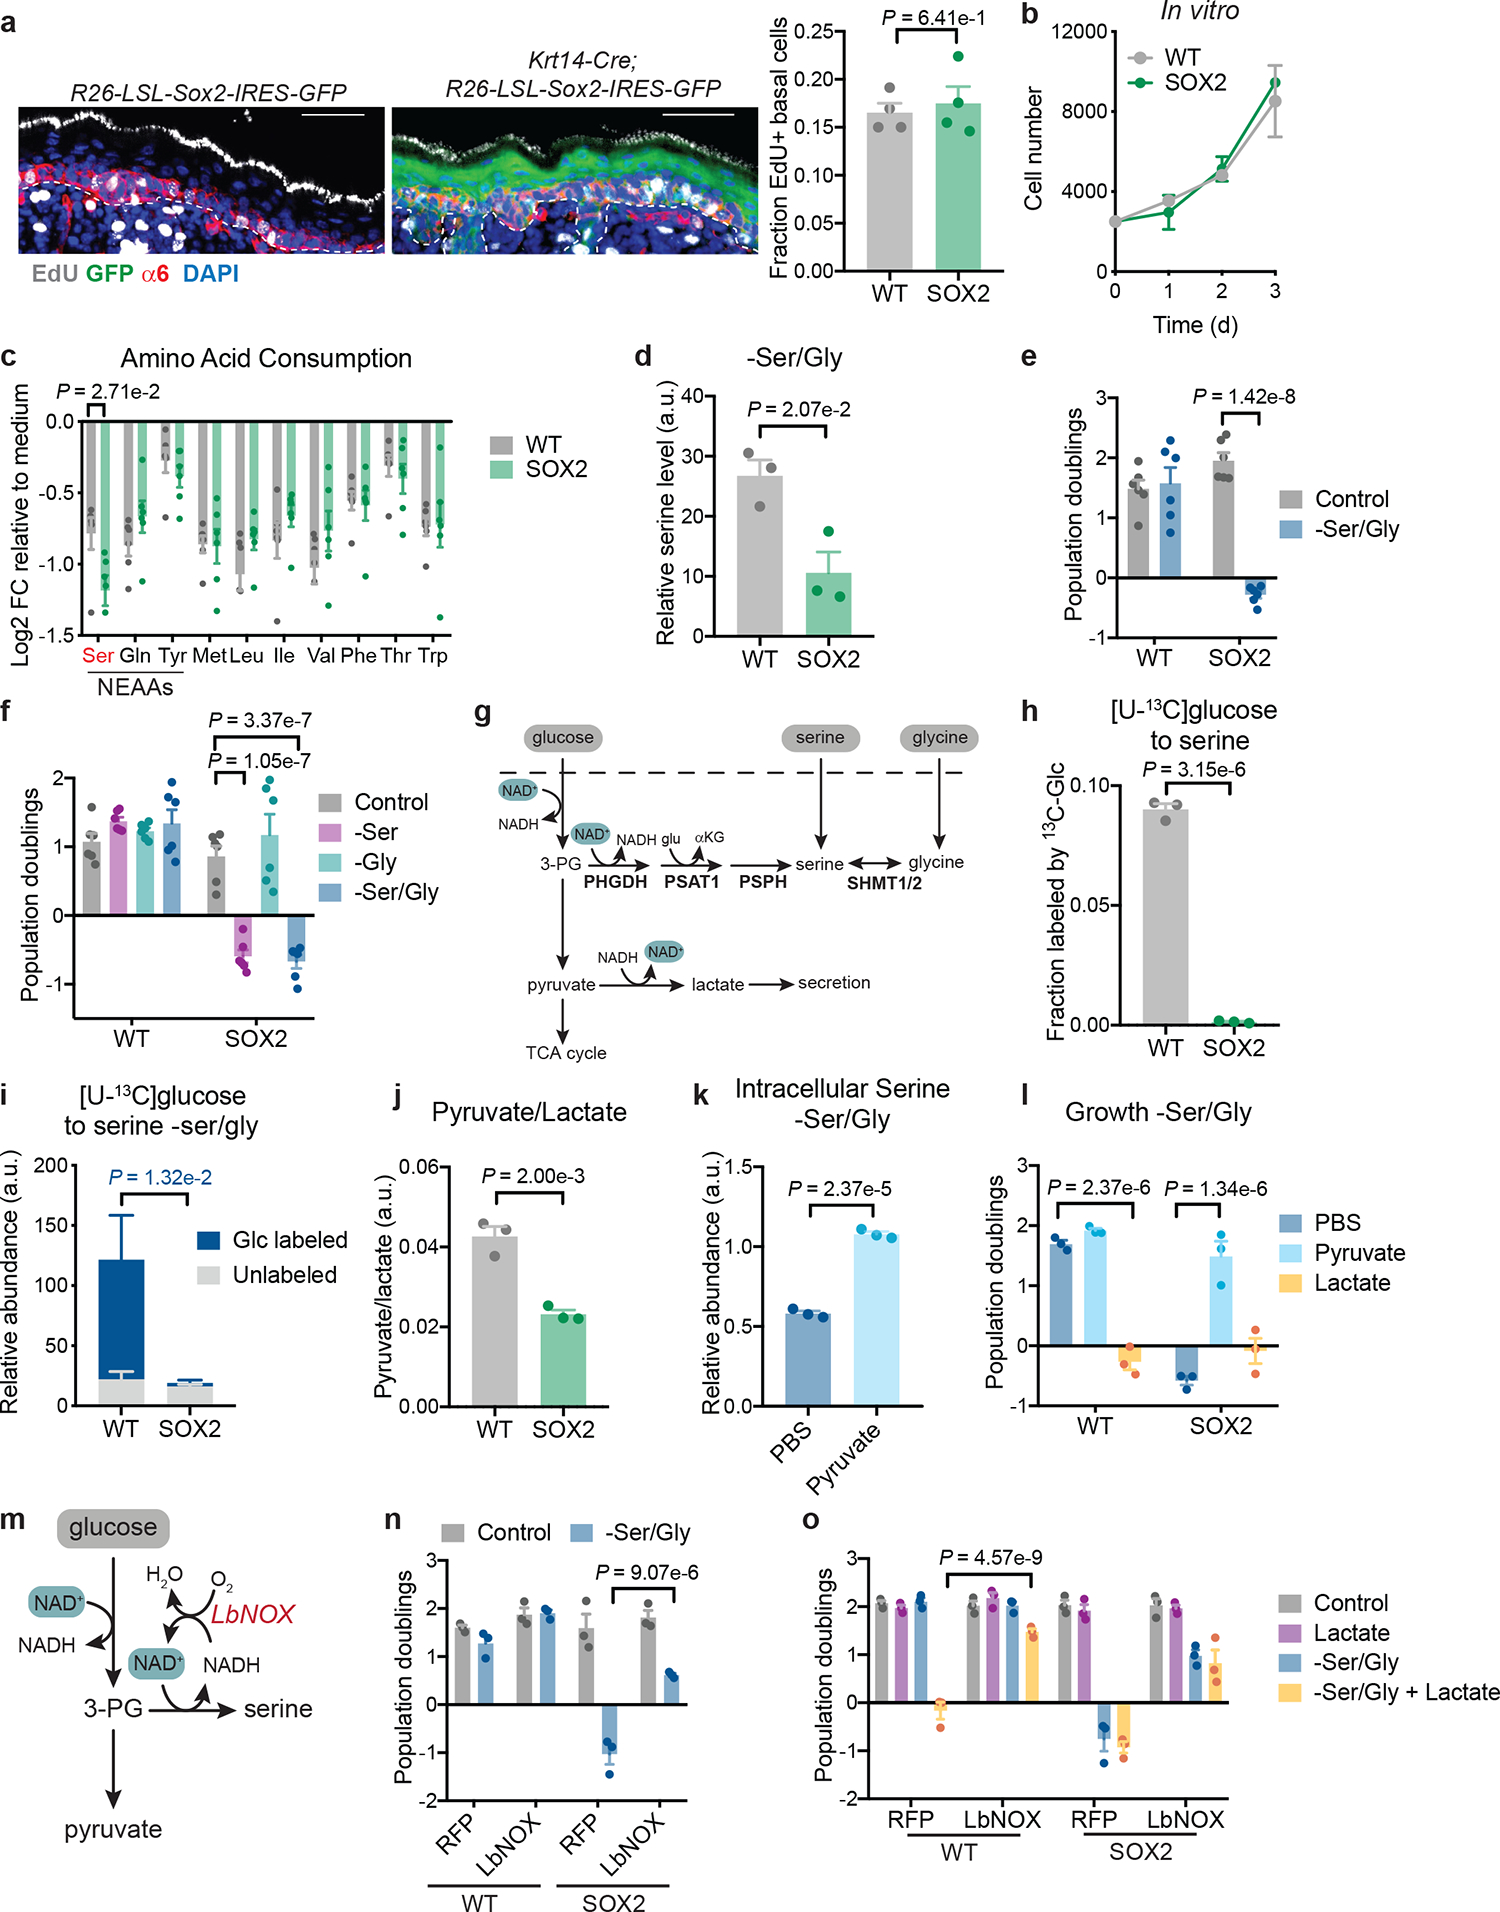
Fig. 1. Pre-malignant epidermal stem cells are serine auxotrophs.

a, EdU incorporation into integrin-α6+ EpdSCs in P4 WT (R26-LSL-Sox2-IRES-eGFP) and SOX2+ (K14-Cre+/wt;R26-LSL-Sox2-IRES-eGFP) mice (n=4 mice per genotype). Data are mean ±SD. b, Growth of independently derived WT-1,2,3 and SOX2+−1,2,3 EpdSC cultures (n=3 independent experiments). Data are mean ±SD. c, Gas chromatography-mass spectrometry (GC-MS) of conditioned medium relative to control medium (n=6 biologically independent samples). Data are mean ±SEM. NEAA indicates non-essential amino acids that are consumed. d, Intracellular serine pools following 16 h of Ser/Gly starvation (n=3 biologically independent samples). Data are mean ±SEM. e, Proliferation of WT-1,2,3,4,5,6 and SOX2+−1,2,3,4,5,6 lines during 48 h of growth in indicated medium (n=6 independent experiments). Data are mean ±SEM. f, Population doublings of WT-1,2,3,4,5,6 and SOX2+−1,2,3,4,5,6 lines during 48 h of growth in indicated medium (n=6 independent experiments). Data are mean ±SEM. g, Schematic of intracellular serine sources. h-i, Labeling of serine from [U-13C]glucose in complete medium (n=3 biologically independent samples) (h) or in Ser/Gly-free medium (n=3 independent experiments) (i). Data are mean ±SD. j, GC-MS of the intracellular pyruvate/lactate ratio (n=3 biologically independent samples). Data are mean ±SEM. k, GC-MS of intracellular serine pools of SOX2 cells –Ser/Gly with or without 2 mM pyruvate (n=3 biologically independent samples). Data are mean ±SEM. l, Population doublings of EpdSCs cultured for 48 h in Ser/Gly-free medium with addition of PBS, 2 mM lactate or 2 mM pyruvate (n=3 biologically independent samples). Data are mean ±SEM. m, Schematic of LbNOX mechanism of action. n, Population doublings of EpdSCs expressing either RFP control or LbNOX during 48 h of Ser/Gly starvation (n=3 biologically independent samples). Data are mean ±SEM. o, Population doublings of EpdSCs expressing either RFP or LbNOX during 48 h of culture in indicated medium (n=3 biologically independent samples). Data are mean ±SEM. Scale bar = 50 μm. Statistical significance was determined using unpaired two-tailed student’s t-test for panels a, c d, h, j and k; two-way ANOVA with Sidak’s multiple comparison test in panels e and i, and two-way ANOVA with Tukey’s multiple comparison test in panel f, l, n, and o. Numerical data are provided in Statistics Source Data Fig. 1.
