
Extended Data Fig. 3. Effects of serine starvation on epidermal growth and differentiation.
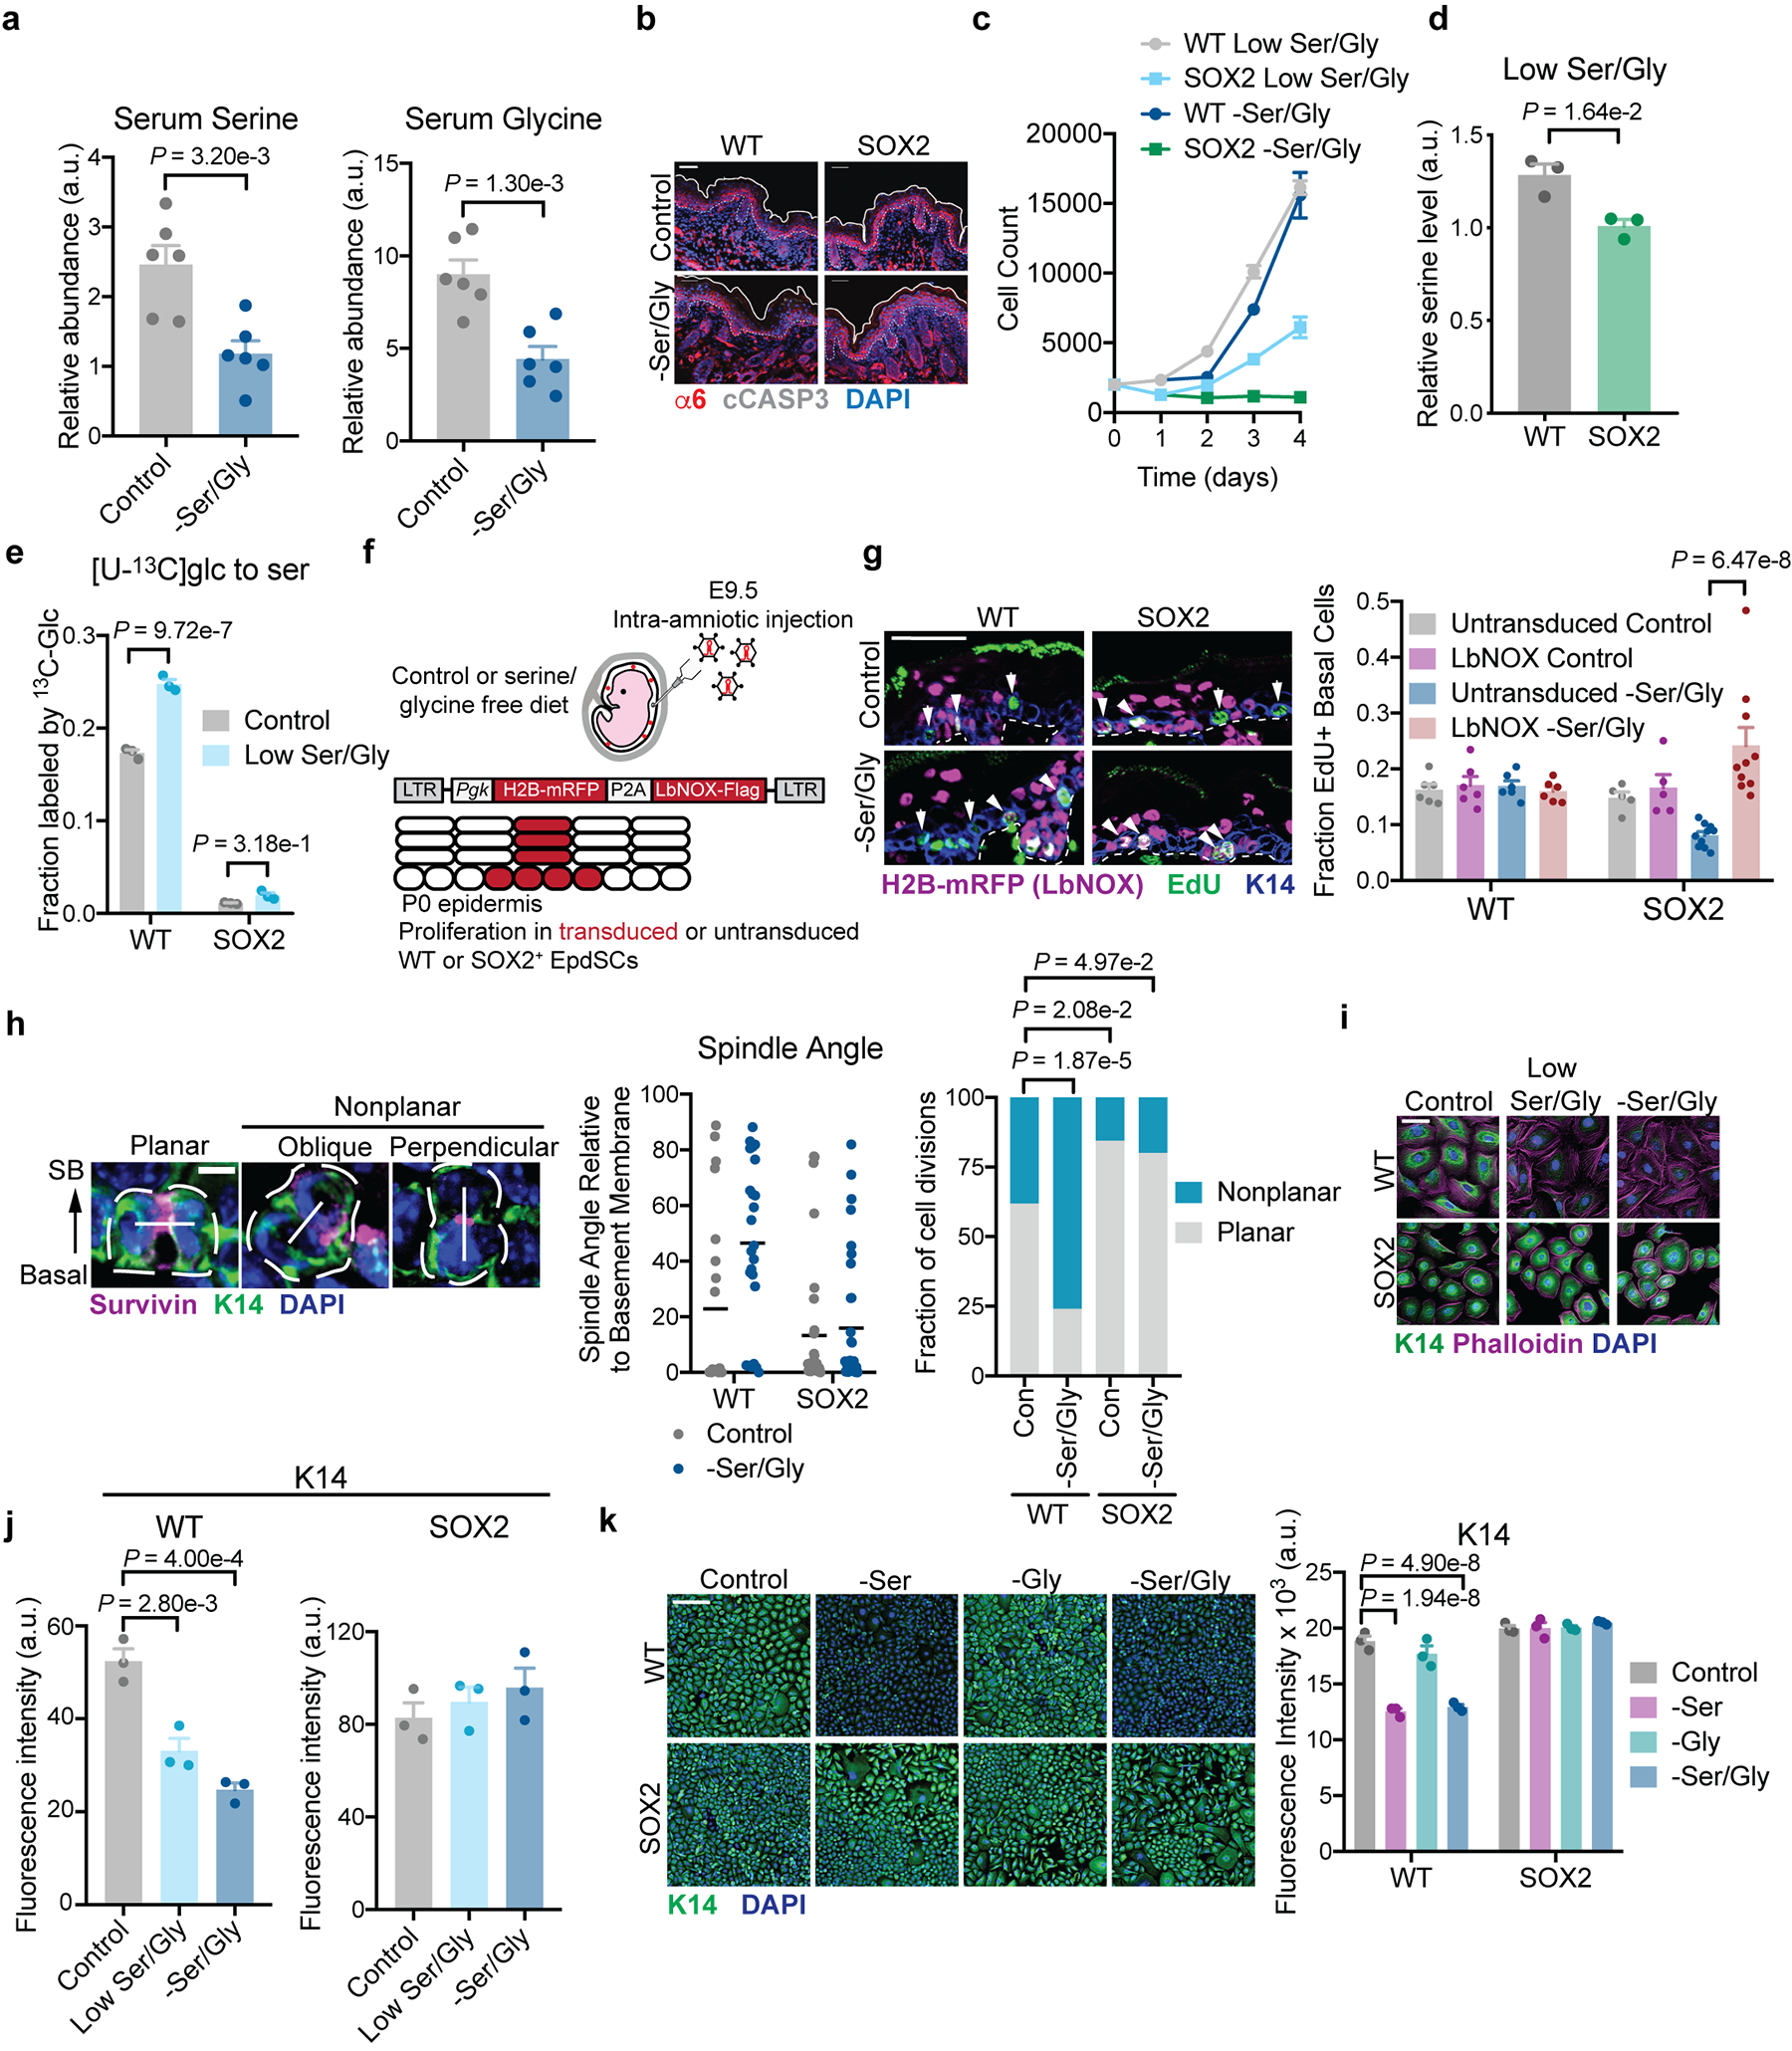
a, Serum serine and glycine in female mice maintained on indicated chow for 2 weeks (n=6 mice per condition). Data are mean ±SD. b, Representative immunofluorescence of cleaved caspase 3 in P0 WT and SOX2+ mice. Analysis was performed on 3 mice/condition with similar results. c, Growth curve in indicated media (n=3 biologically independent samples). d-e, Intracellular serine pools (d) and 4-hr fractional labeling from glucose (e) following 24 h of low Ser/Gly culture (n=3 biologically independent samples). f, Schematic of in vivo LbNOX expression experiment. g, Proliferation in P0 mice on control or Ser/Gly-free diet (n=6 WT control, 5 WT –Ser/Gly, 6 SOX2+ control, 10 SOX2+ –Ser/Gly mice). h, Immunofluorescence of cell division classes based on Survivin staining (left), quantification of spindle angle relative to the basement membrane in P0 WT and SOX2+ SCs on control or Ser/Gly-free diet (middle, data are mean), and binning of spindle axes in WT control (n=21 mitoses), WT –Ser/Gly (n=25 mitoses), SOX2+ control (n=32 mitoses) and SOX2+ -Ser/Gly (n=35 mitoses) (right). Mitoses were counted across three animals per condition. Scale bar = 5 μm. SB = suprabasal. i-j, Immunofluorescence (i) and quantification (j) of K14 in indicated media (n=3 independent experiments). Scale bar = 50 μm k, Immunofluorescence of K14 in indicated media (n=3 independent experiments). Scale bar = 50 μm. Unless indicated all data are mean ±SEM. Statistical analysis was performed by an unpaired two-tailed student’s t-test for panels a and d, a two-way ANOVA with Sidak’s multiple comparison test for panels e and g and Tukey’s multiple comparison test in panel k, a parts of whole Chi-Square analysis in panel h, and a one-way ANOVA with Tukey’s multiple comparison test in panel j. Numerical data are provided in Statistics Source Data Extended Fig. 3.