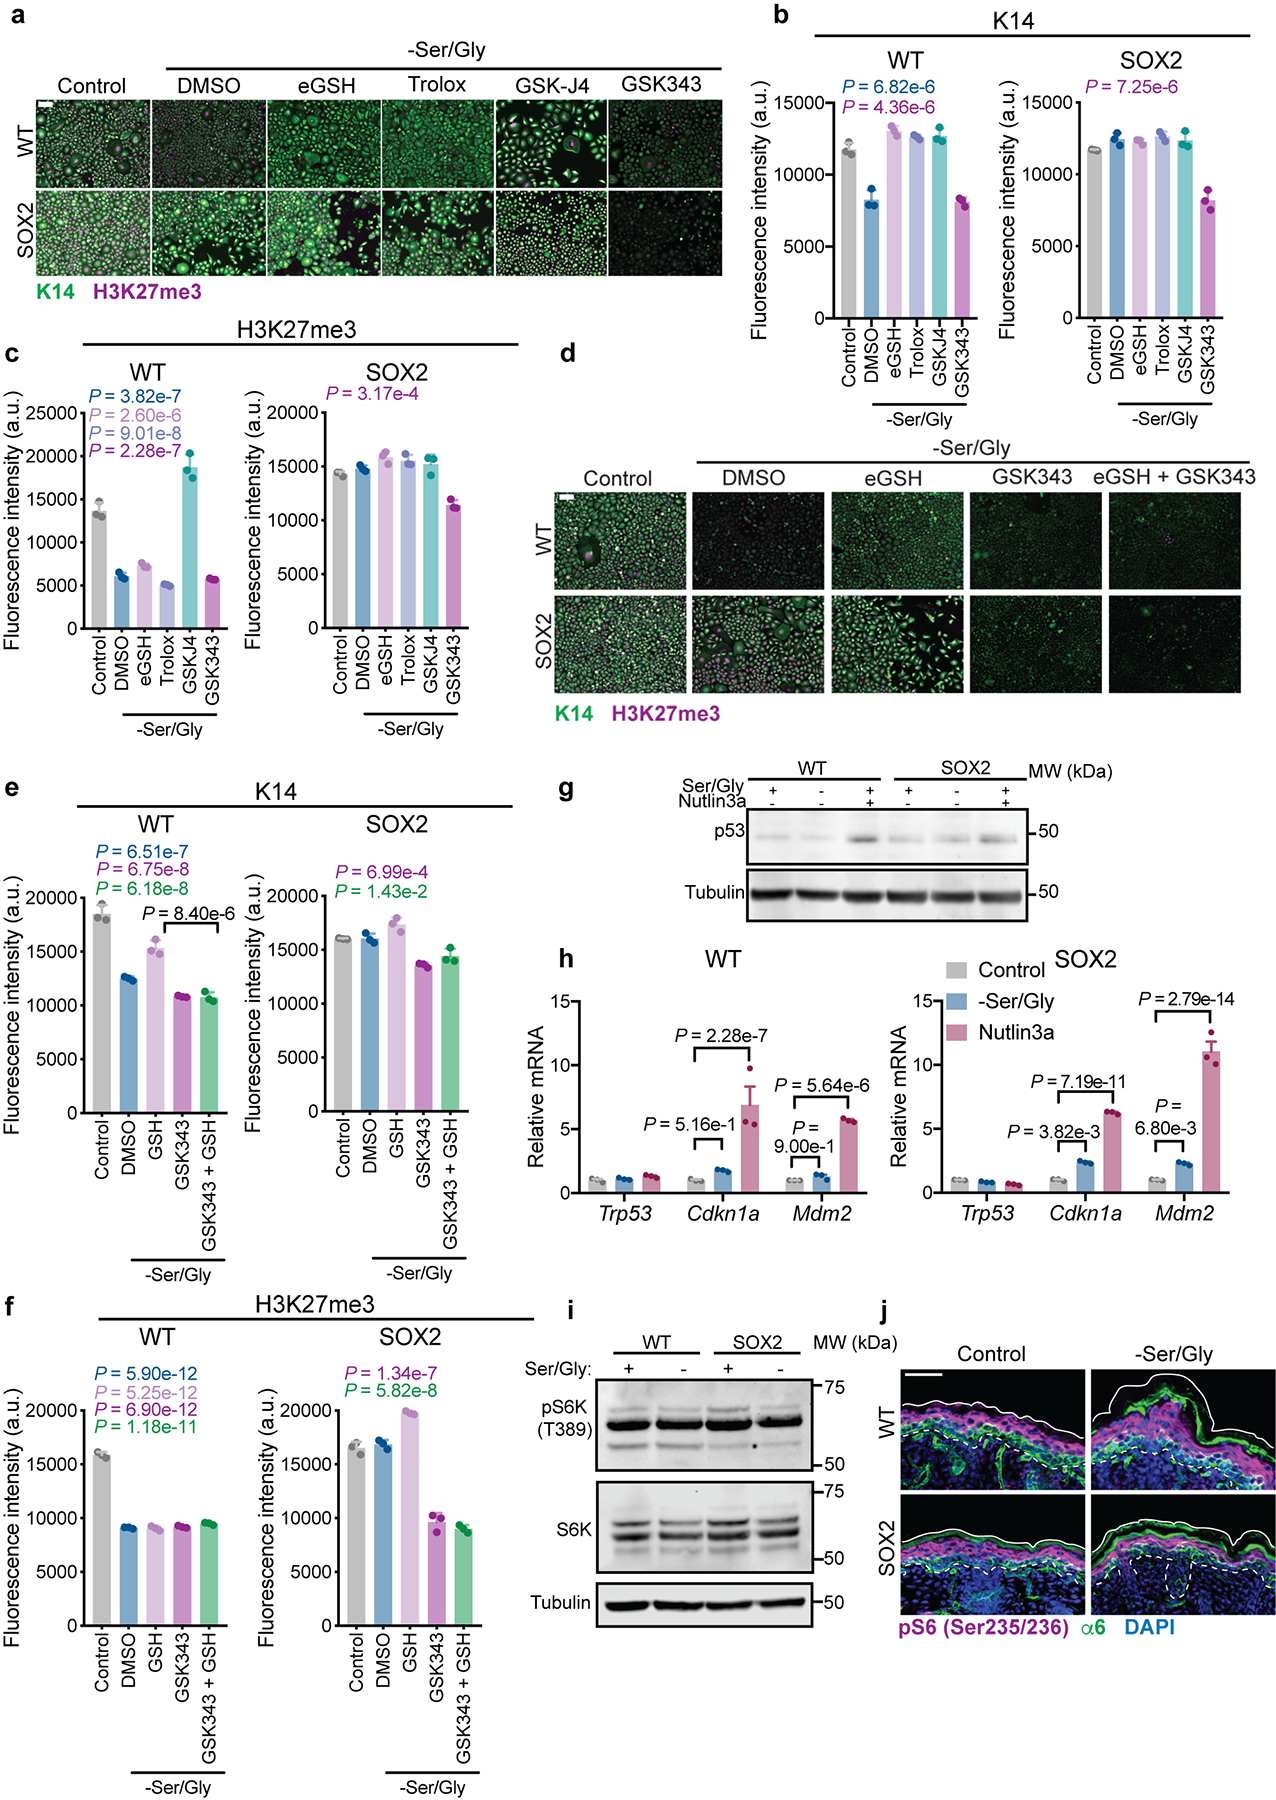
Extended Data Fig. 6. Role of ROS, p53 and mTORC1 signaling in serine starvation response.

a-c, Representative immunofluorescence (a) and quantification of K14 (b) and H3K27me3 (c) in WT and SOX2+ cells cultured with cell-permeable esterified reduced glutathione (eGSH), the antioxidant Trolox, the JMJD3 inhibitor GSK-J4, or the EZH2 inhibitor GSK343, performed in triplicate. (n = 3 independent experiments). d-f, Representative immunofluorescence (d) and quantification of K14 (e) and H3K27me3 (f) in WT and SOX2+ cells in indicated conditions, (n = 3 independent experiments). g, Representative immunoblot of p53 stabilization upon 24 h Ser/Gly starvation or treatment with 10 μM of the MDM2 inhibitor Nutlin-3a, performed in duplicate. Experiment was performed in triplicate with similar results. h, RT-qPCR for expression of canonical p53 target genes (n=3 independent experiments). i, Representative immunoblot for phosphorylation of the mTORC1 target S6K following 24 h Ser/Gly starvation, performed in duplicate. Experiment was performed in triplicate with similar results. j, S6 phosphorylation in P0 mice on a control or Ser/Gly-free diet (n = 3 animals analyzed per condition). Scale bar = 50 μm. All data are mean ±SEM. Statistical significance was determined using an ordinary one-way ANOVA with Tukey’s multiple comparison test for panels b, c, e and f (P-values are relative to control) and a two-way ANOVA with Sidak’s multiple comparison test for panel h. Scanned images of unprocessed blots are shown in Source Data Extended Fig. 6. Numerical data are provided in Statistics Source Data Extended Fig. 6.
