
Extended Data Fig. 9. Glucose-derived serine synthesis suppresses tumorigenesis.
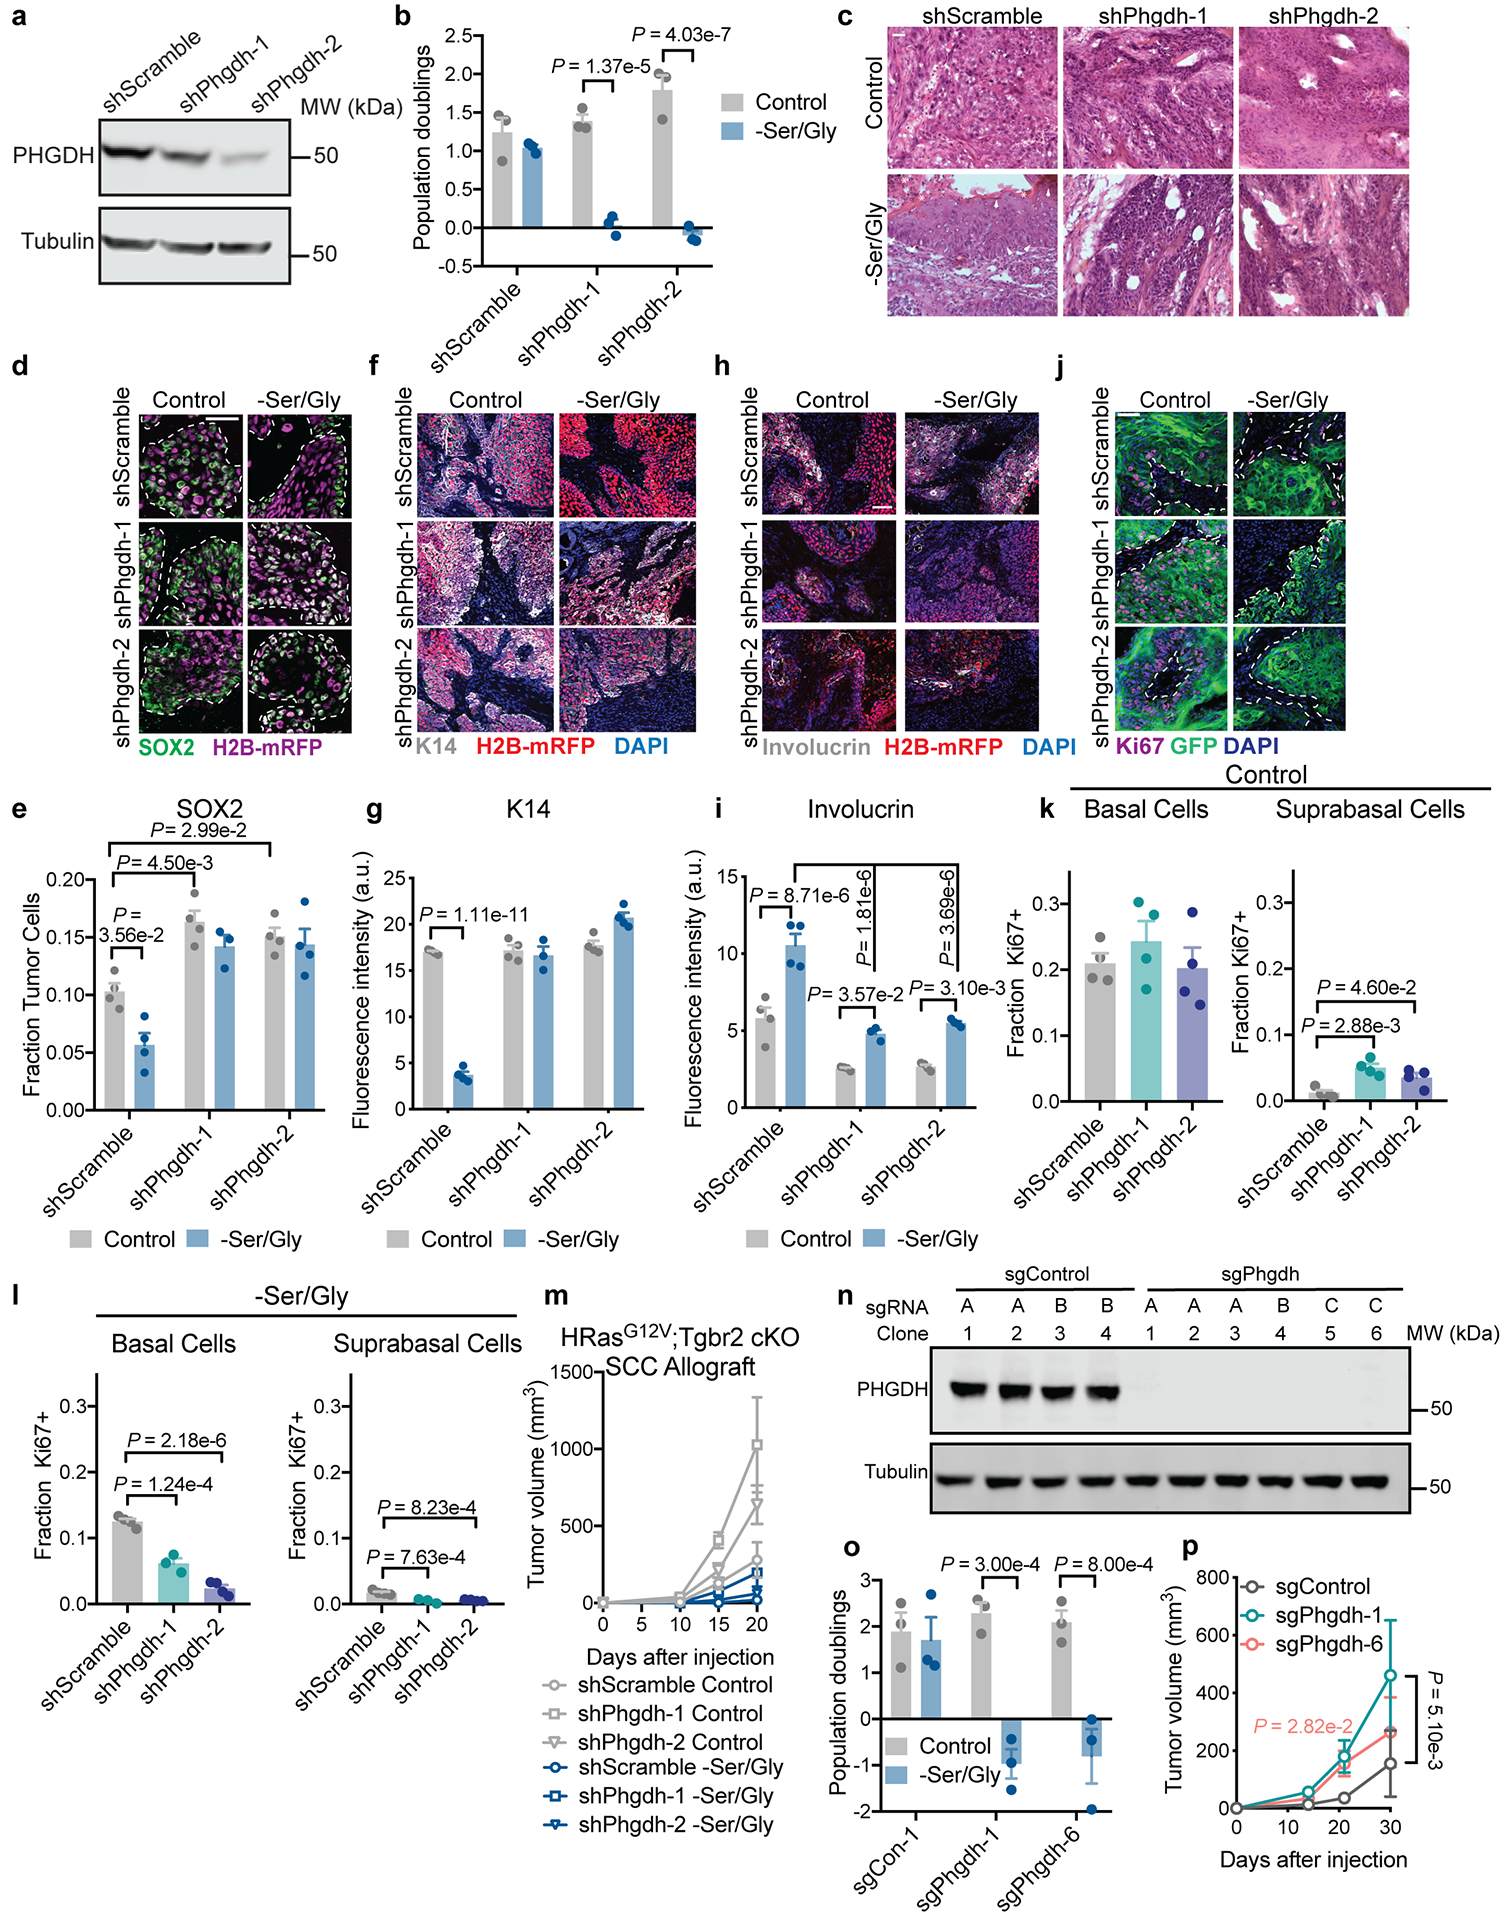
a, Representative PHGDH knockdown efficiency in mouse SCC cells. Experiment performed in duplicate independent experiments with similar results. b, Population doublings of shPhgdh SCC cells in vitro during 48 h of Ser/Gly starvation (n=3 biologically independent samples). c, Representative H&E of shScramble and shPhgdh SCCs. Asterisks denote keratin pearls, arrows denote keratohyalin granules, arrowheads denote intercellular bridges, all signs of differentiation in SCCs. Three tumors analyzed per condition with similar results. d-l, Immunofluorescence and analysis of SOX2 (d,e), K14 (f,g), Involucrin (h,i) and Ki67 (j-l) in shScramble and shPhgdh SCCs (n=3 tumors for shPhgdh-1 –Ser/Gly, n=4 tumors for all other conditions). m, Growth of SCCs (n=4 tumors per condition). n, Verification of Phgdh knockout by immunoblot in SCC cells. Experiment was performed in duplicate with similar results. sgRNA sequence information can be found in Supplementary Table 6. o, Population doublings of sgPhgdh SCC cells in vitro during 48 h of Ser/Gly starvation (n=3 biologically independent samles). p, Growth of sgPhgdh SCC cells orthotopically grafted into Nude mice (n=8 tumors for days 1–30, n=24 tumors for days 1–24). Scale bar = 50 μm. All data are mean ±SEM. Statistical significance was determined using a two-way ANOVA with Sidak’s multiple comparison test in panels b and o, with Tukey’s multiple comparison test in e, g and i, with Dunnett’s multiple comparison test in panel p, and an ordinary one-way ANOVA with Tukey’s multiple comparison test in panels k and l. Scanned images of unprocessed blots are shown in Source Data Extended Fig. 9. Numerical data are provided in Statistics Source Data Extended Fig. 9.