
Fig. 2. Restricting extracellular serine and glycine induces epidermal differentiation.
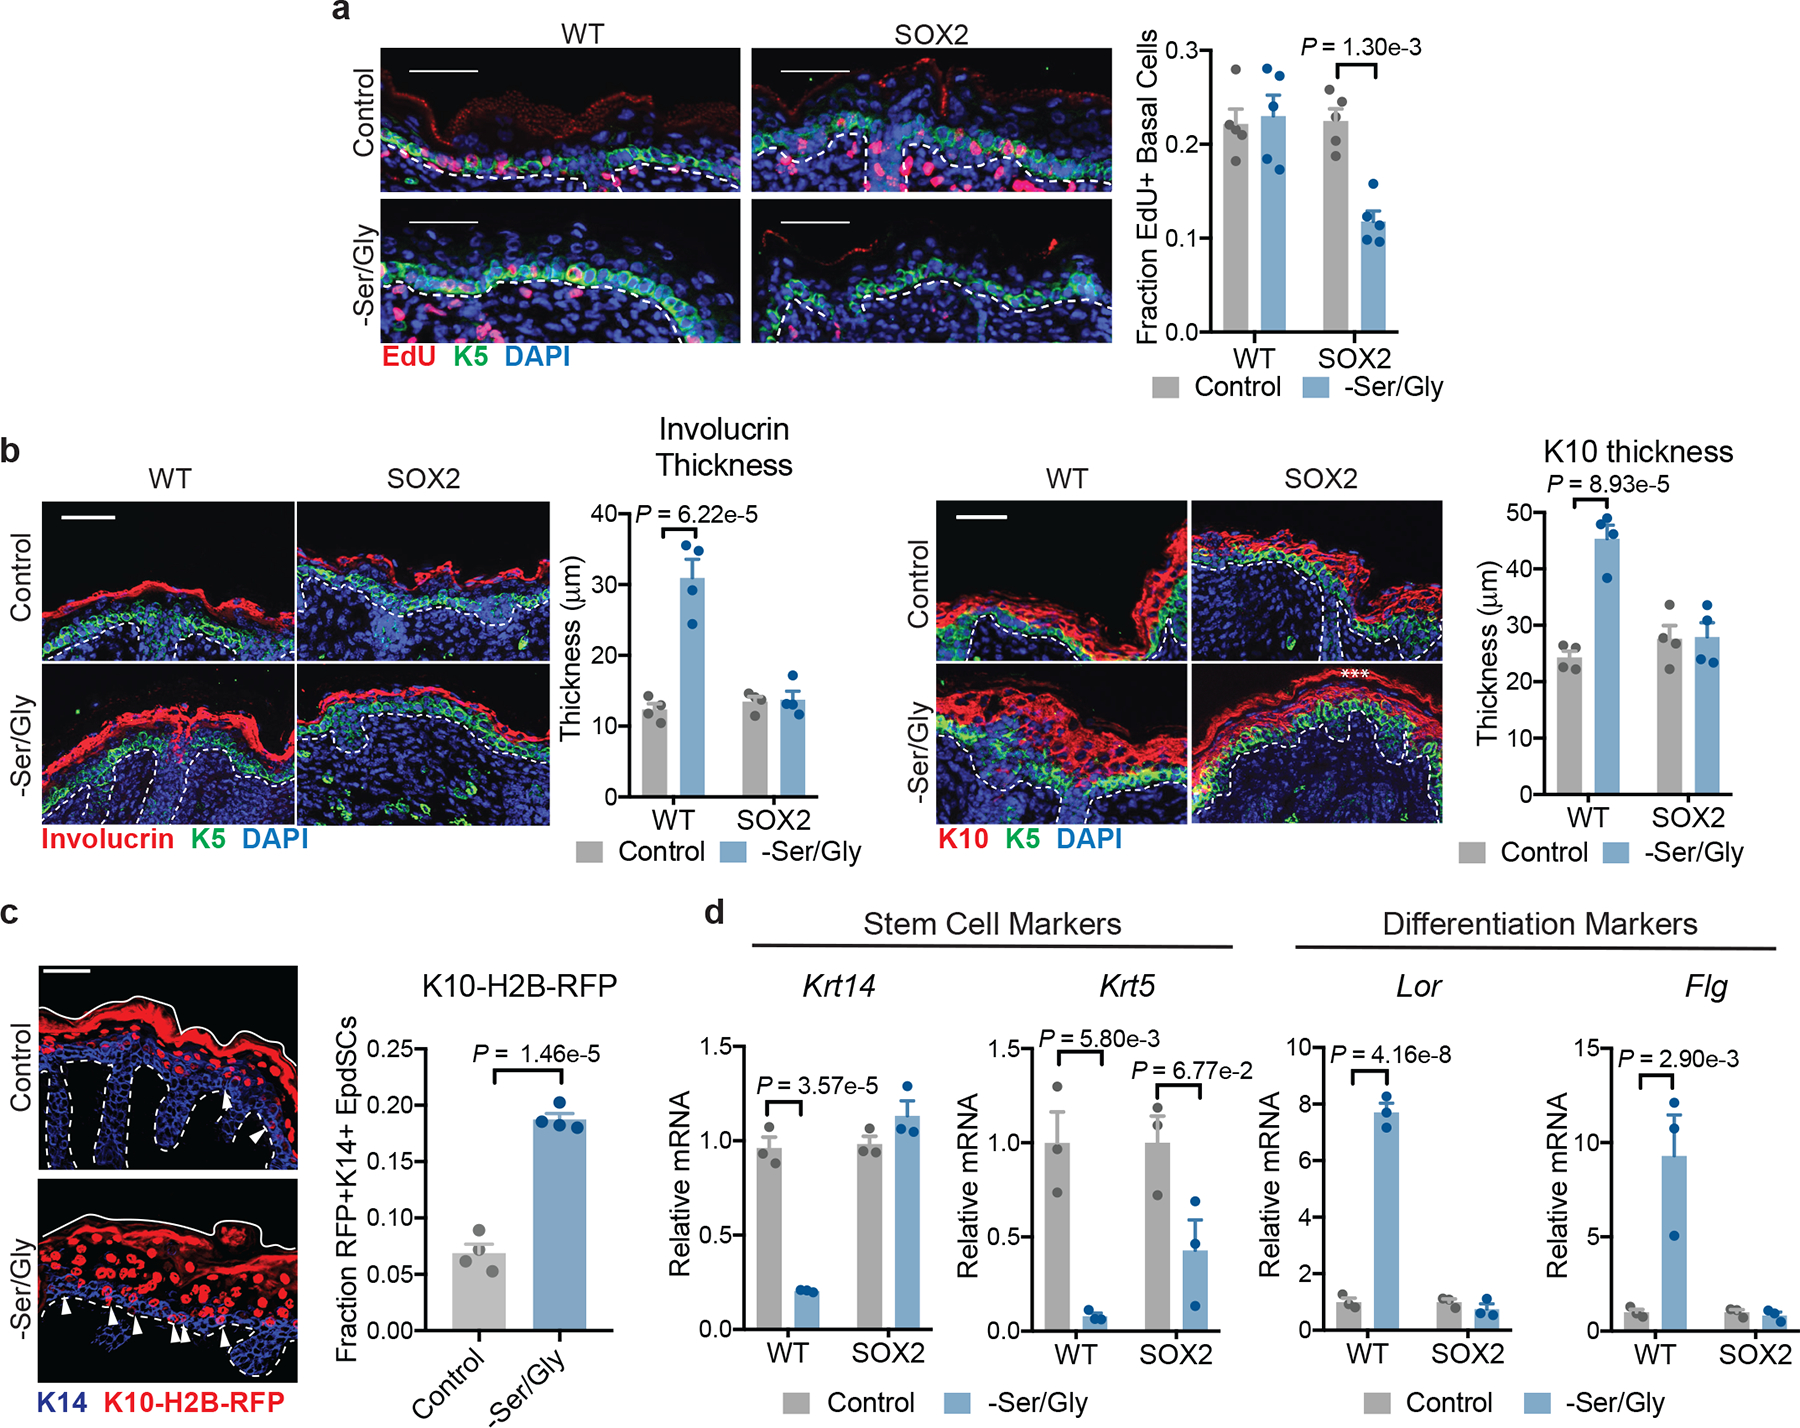
a, Imaging (left) and quantification (right) of EdU incorporation into K5+ EpdSCs in P0 WT and SOX2+ mice where mothers were maintained on control or Ser/Gly-free diet (n=5 mice per condition). Data are mean ±SEM. b, Immunofluorescence of the differentiated cell markers Involucrin (left) and K10 (right) in P0 mice on control or Ser/Gly-free diet (n=4 mice per condition). Data are mean ±SEM. Asterisk represents autofluorescence. c, Immunofluorescence (left) and quantification (right) of the differentiation reporter Krt10-H2B-mRFP in EpdSCs of P0 WT mice on control or Ser/Gly-free diet (n=4 mice per condition). Data are mean ±SEM. d, qPCR for the stem cell markers Krt5 and Krt14 (left) and differentiated cell markers Lor and Flg (right) following 24 h of Ser/Gly starvation (n=3 independent experiments). Data are mean ±SEM. Scale bar = 50 μm. Statistical significance was determined using a two-way ANOVA with Tukey’s multiple comparison test for panels a, b and d, and an unpaired two-tailed student’s t-test for panel c. Numerical data are provided in Statistics Source Data Fig. 2.