
Fig. 3. Serine synthesis drives α-ketoglutarate-dependent differentiation.
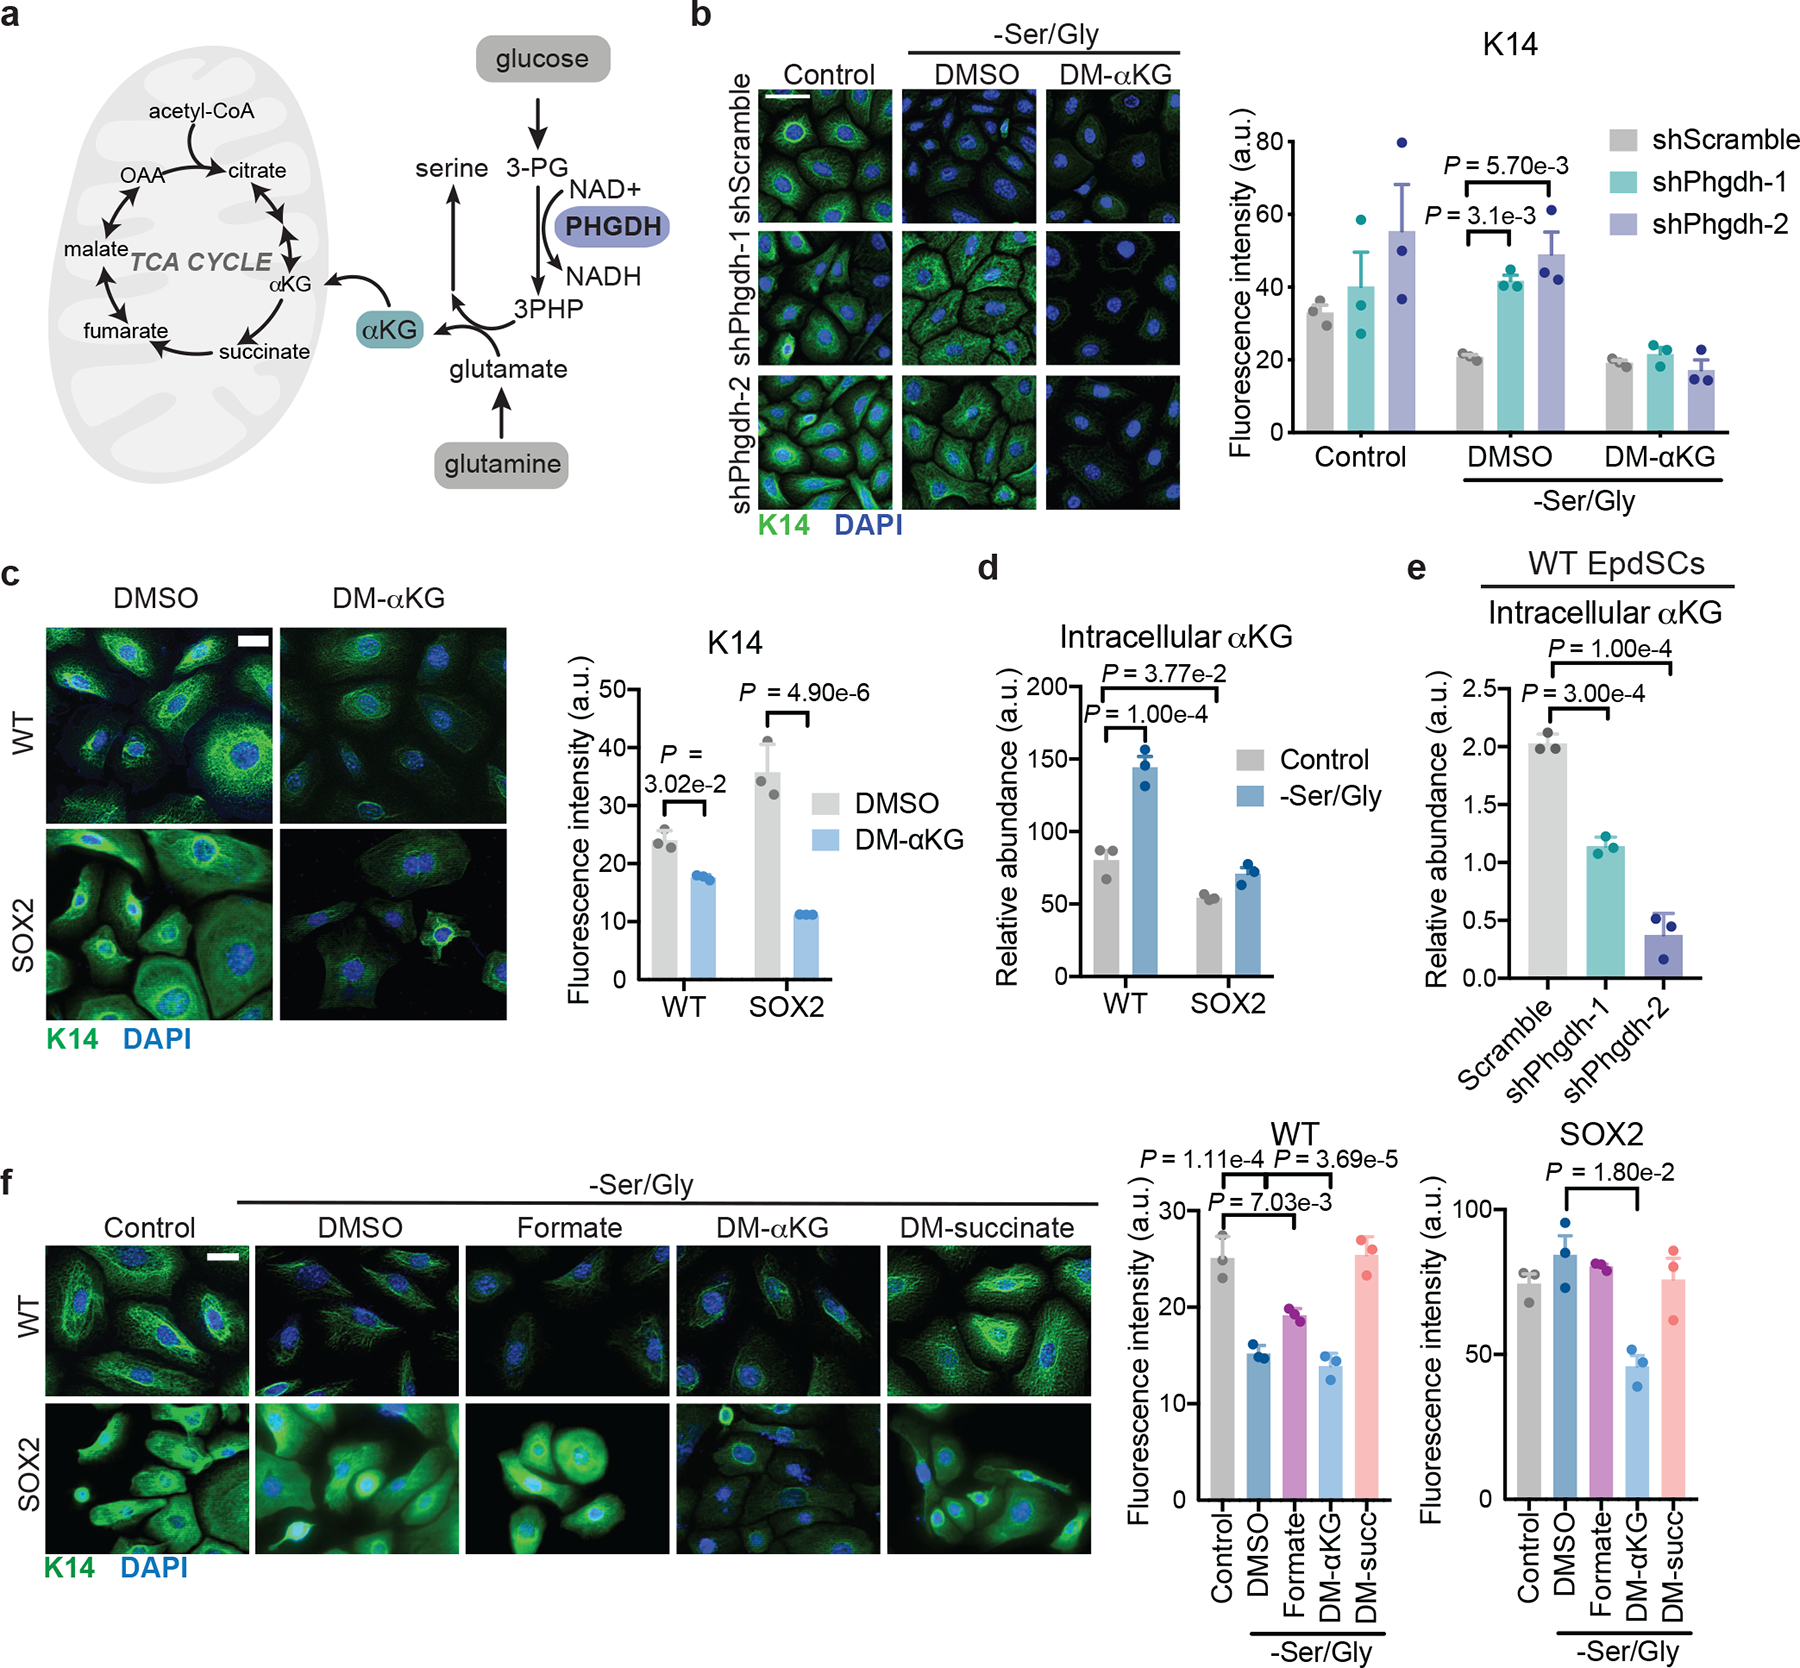
a, Schematic of serine synthesis and its byproducts. b, Immunofluorescence of K14 in WT shScramble or shPhgdh EpdSCs upon Ser/Gly starvation with DMSO or 4 mM DM-αKG (n=3 independent experiments). Data are mean ±SEM. Scale bar = 50 μm. c, Immunofluorescence of K14 in cells cultured with 4 mM DM-αKG in complete medium (n=3 independent experiments). Scale bar = 5 μm. Data are mean ±SEM. d-e, Intracellular αKG pools of WT and SOX2+ cells (d) or WT cells expressing the indicated hairpins (e) following 16 h of Ser/Gly starvation (n=3 biologically independent samples). Data are mean ±SEM. f, Immunofluorescence and quantification of K14 in cells cultured with DMSO, 1 mM formate, 4 mM DM-αKG, or 4 mM DM-succinate for 24 h (n=3 independent experiments). Data are mean ±SEM. Scale bar = 5 μm. Statistical significance was determined using a two-way ANOVA with Dunnett’s multiple comparison tests for panel b, with Sidak’s multiple comparison test for panel c, and with Tukey’s multiple comparison test for panel d. An ordinary one-way ANOVA with Dunnett’s multiple comparison test was used for panel e, and with Tukey’s multiple comparison test for panel f. Numerical data are provided in Statistics Source Data Fig. 3.