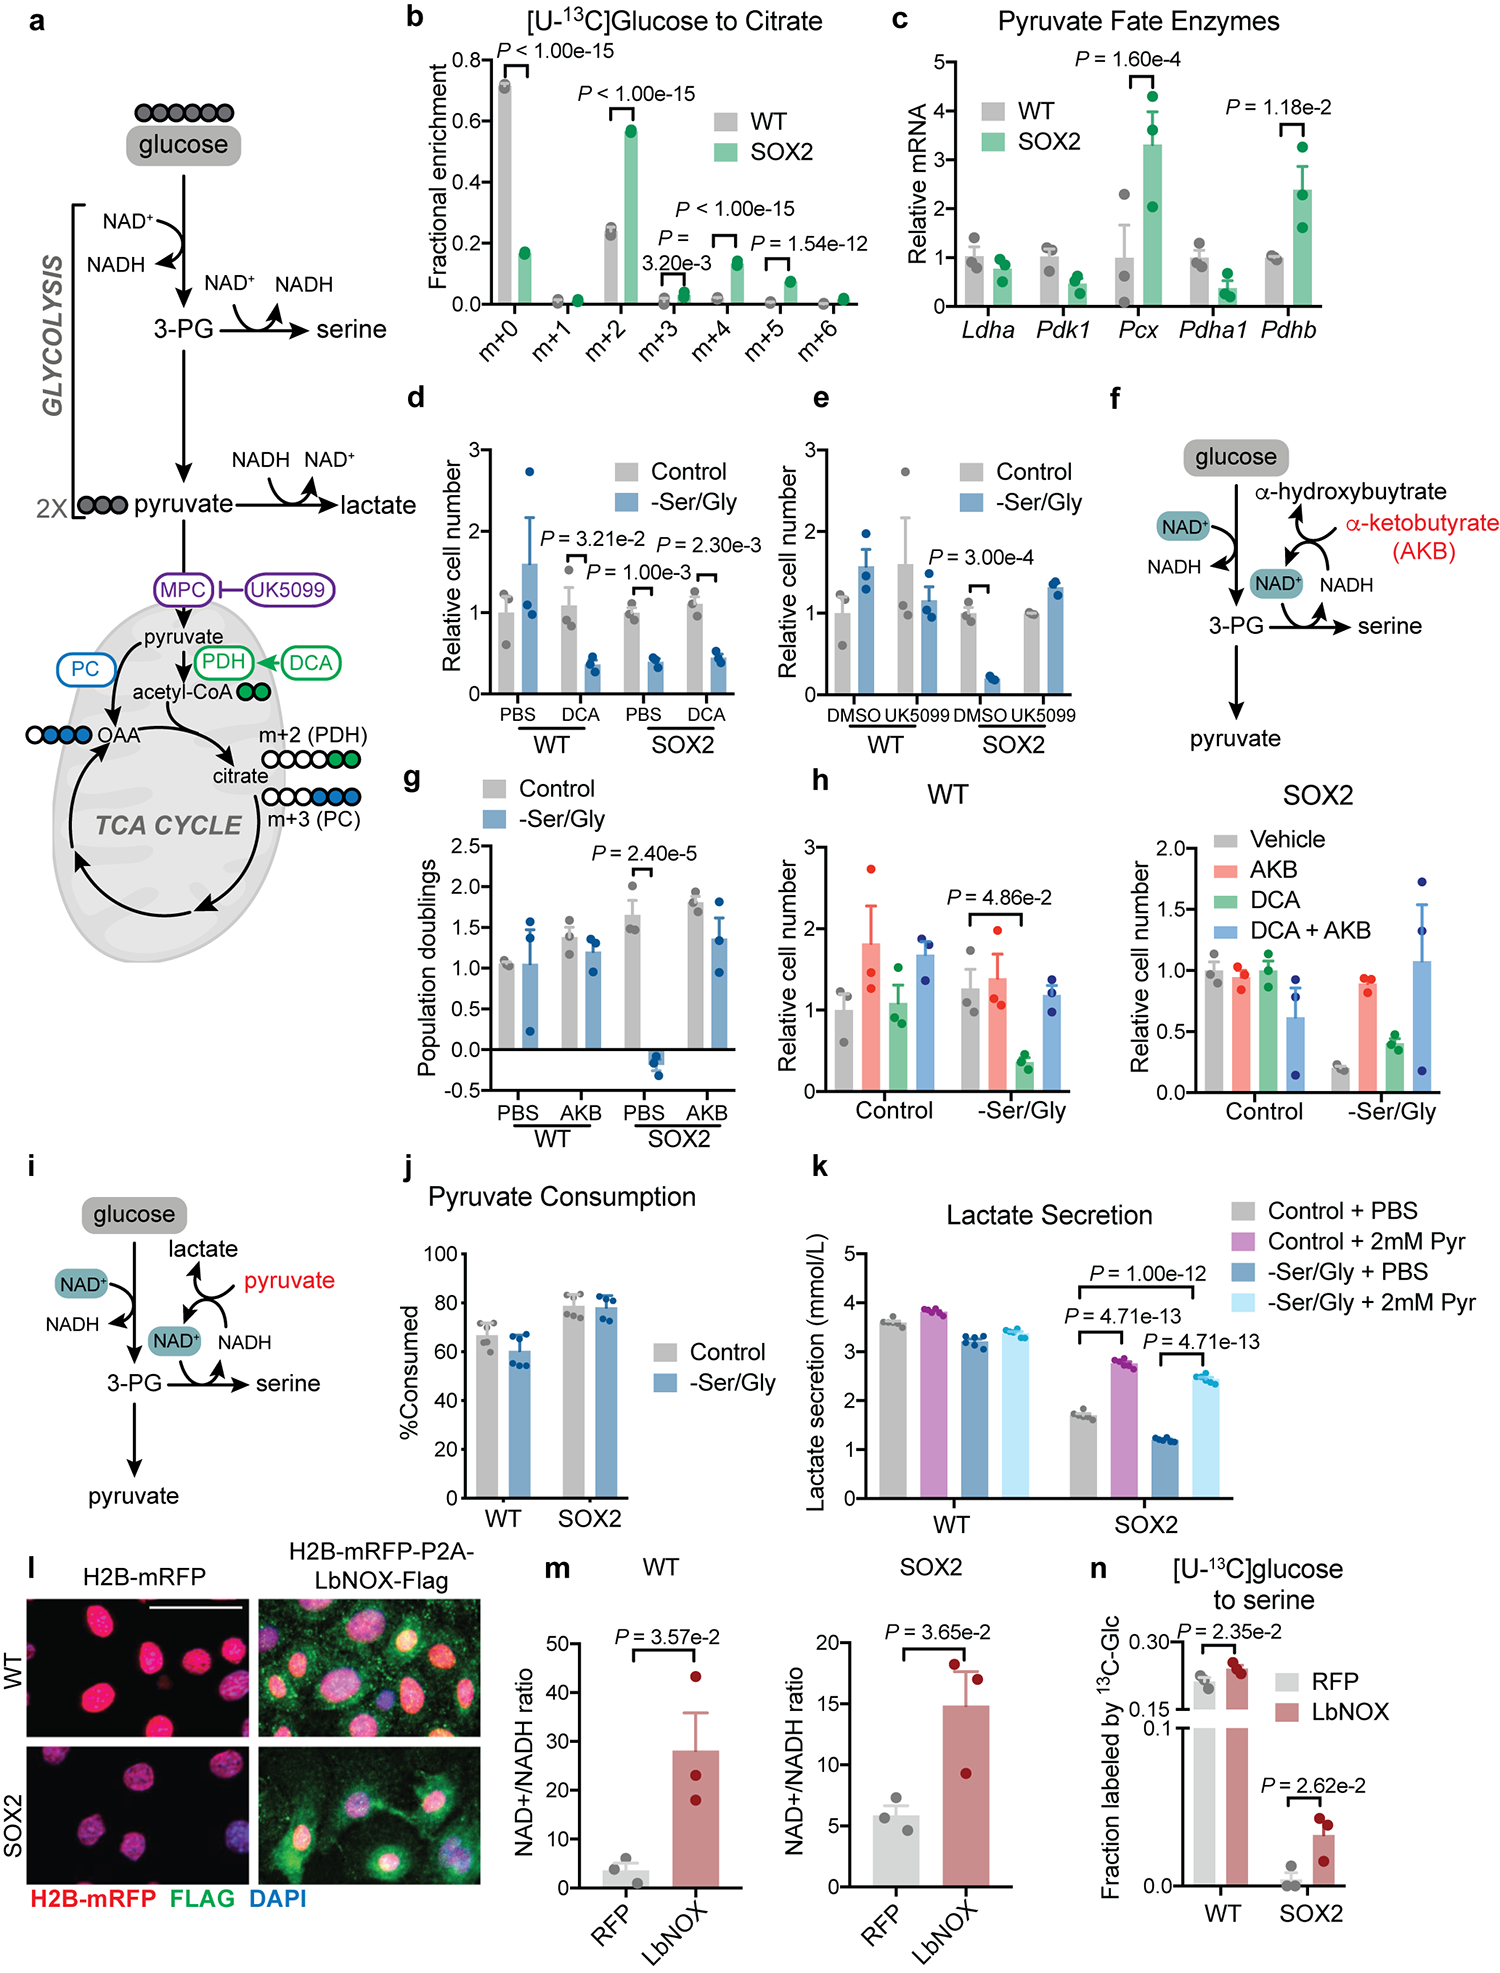
Extended Data Fig. 2. NAD+ regeneration regulates serine auxotrophy.

a, Schematic of glucose metabolism via glycolysis and the TCA cycle, including associated inhibitors. b, Isotopologues of citrate formed from [U-13C]glucose (n=3 biologically independent samples). Data are mean ±SD. M+0 represents the fraction of citrate not labeled by glucose-derived carbons. Heavier isotopologues are formed when glucose is used to generate citrate through either PDH (M+2) or PC (M+3). Higher weight isotopologues are derived from successive turns around the TCA cycle. c, RT-qPCR for pyruvate metabolism genes (n=3 independent experiments). Data are mean ±SEM. d-e, Relative cell number with dichloroacetate (DCA) (n=3 biologically independent samples) (d) or UK-5099 (n=3 biologically independent samples) (e). Data are mean ±SD. f, Mechanism of action of α-ketobutyrate (AKB). g, Proliferation with AKB (n=3 biologically independent samples). Data are mean ±SD. h, Relative cell number with indicated compounds (n=3). Data are mean ±SEM. i, Schematic of pyruvate mechanism of action. j, Percentage of pyruvate consumed after 24 h (n=5 for SOX2+ –Ser/Gly, otherwise n=6 biologically independent samples). Data are mean ±SEM. k, 24 hr lactate secretion into medium (n=6 biologically independent samples). Data are mean ±SEM. l, Representative immunofluorescence of transduced EpdSCs, performed in triplicate independent experiments with similar results. m, Quantification of the whole cell NAD+/NADH ratio (n=3 biologically independent samples). Data are mean ±SEM. n, [U-13C]glucose labeling of serine following 16 h of Ser/Gly starvation (n=3 biologically independent samples). Data are mean ±SEM. Scale bars = 10 μm. Statistical significance was determined using an unpaired two-tailed student’s t-test for panels m, an unpaired two-tailed student’s t-test using the Holm-Sidak method for multiple comparisons in panels d, e and n, a two-way ANOVA with Sidak’s multiple comparison test for panels b, c, g and k, and Dunnett’s multiple comparison test for panel h. Numerical data are provided in Statistics Source Data Extended Fig. 2.
