
Figure 2 |. Performance of CAUSE and other MR methods in simulated data.
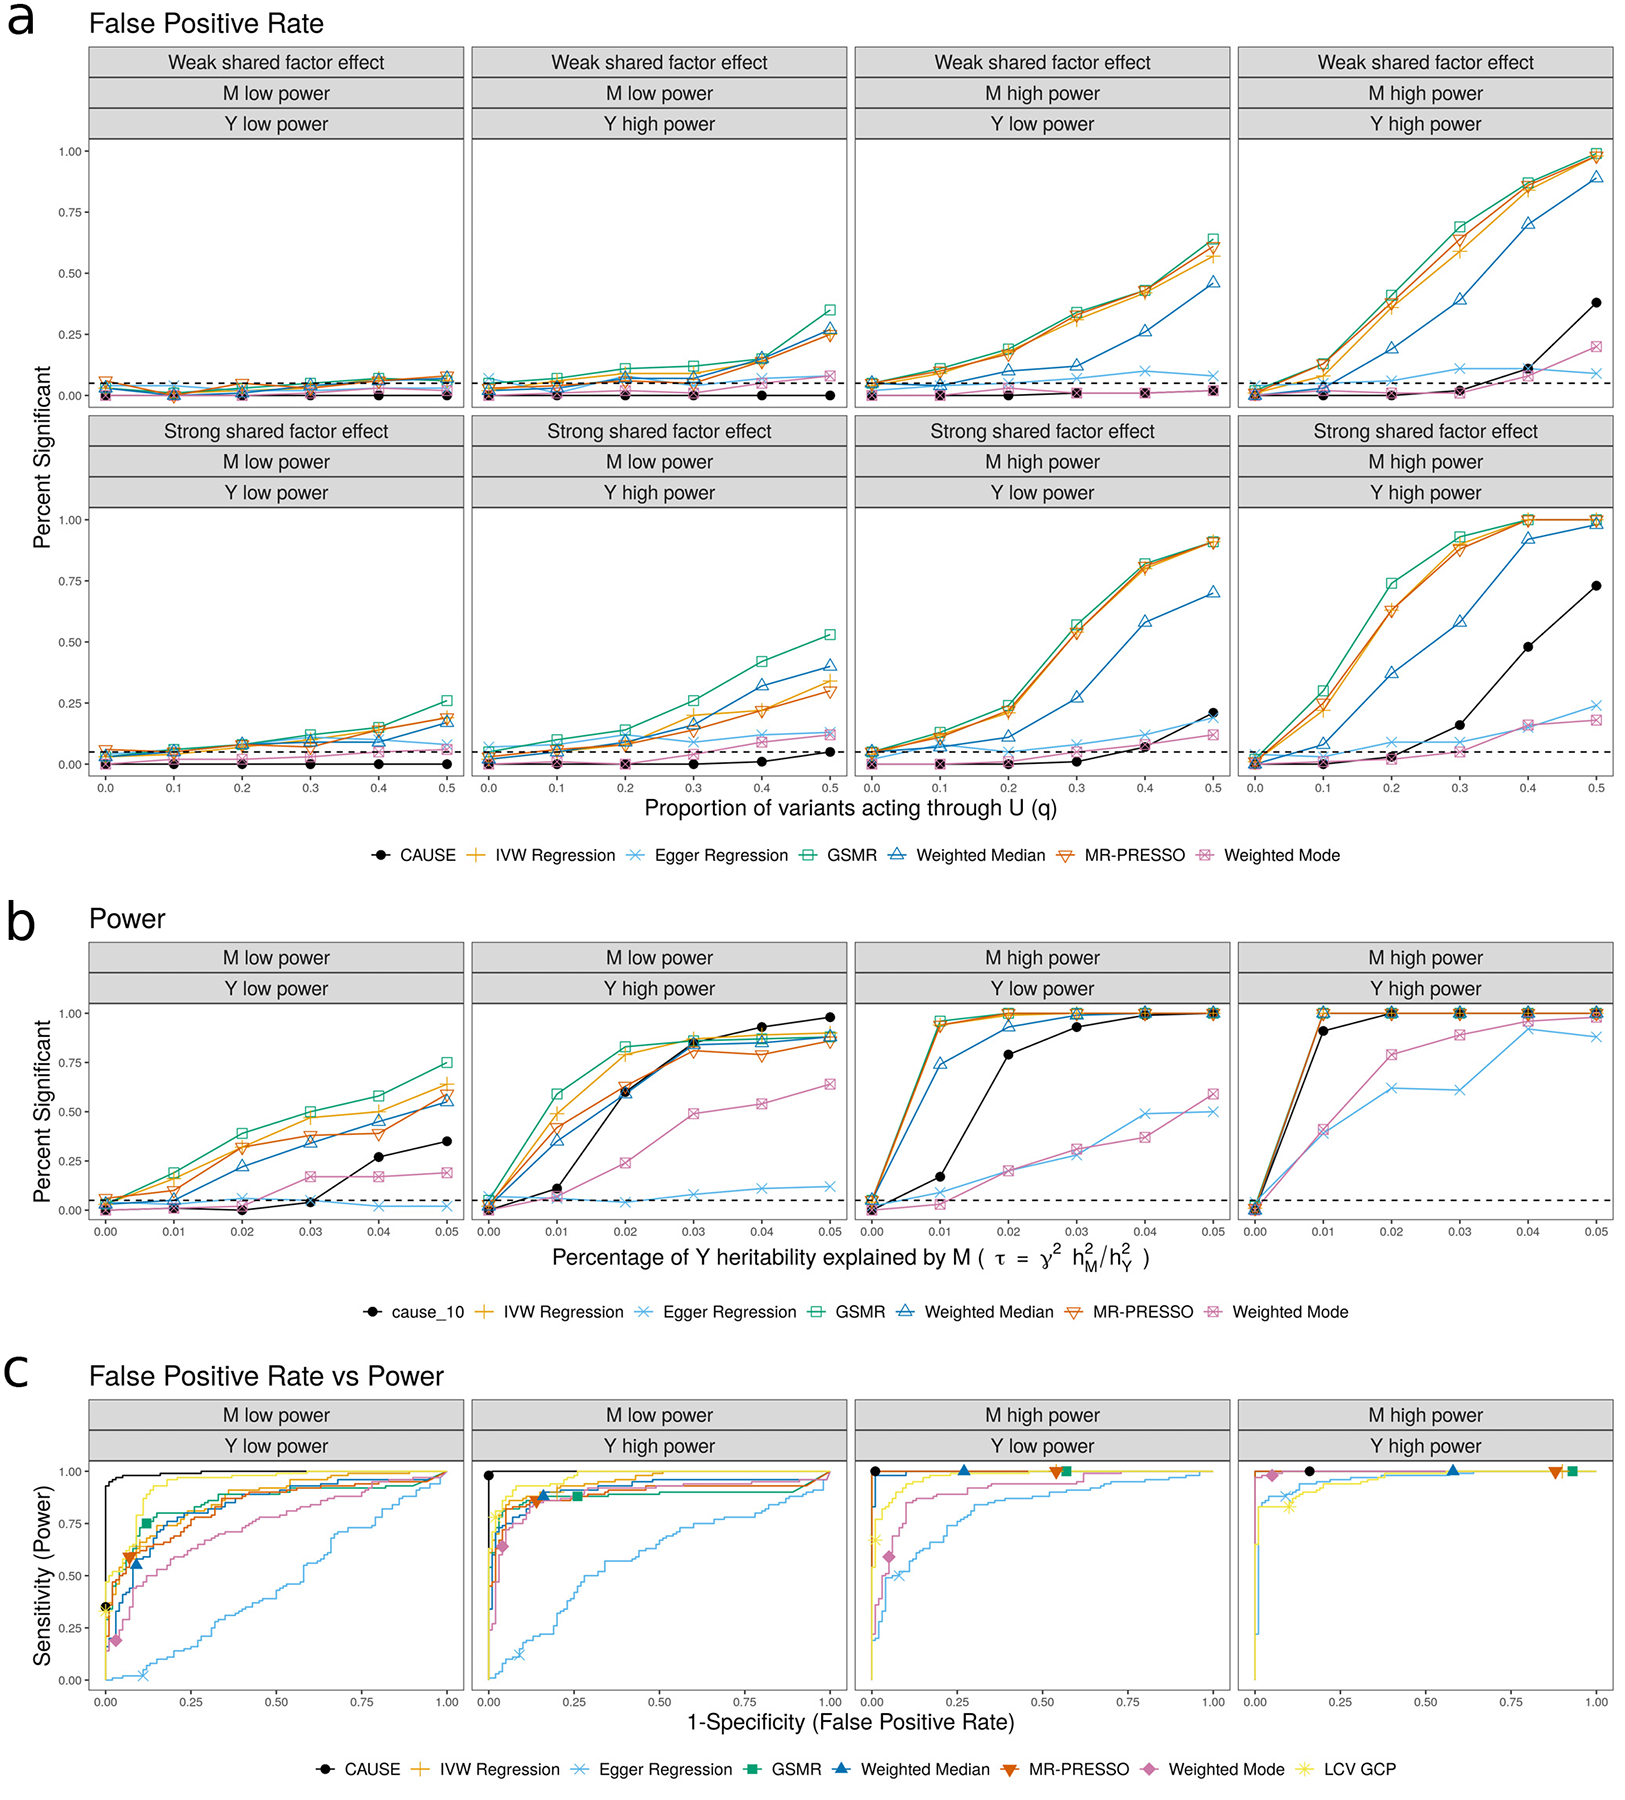
a, False positive rate averaged over 100 simulated data sets in settings with no causal effect and a proportion of correlated pleiotropic variants ranging from 0 to 50%. b, Power averaged over 100 simulated data sets in settings with a causal effect and no shared factor. c, Comparison of false positive-power trade-off. We compare the power when and q = 0 to the false positive rate γ = 0, q = 0.3 and . There are 100 simulations each in the causal and non-causal scenarios. Curves are created by varying the significance threshold. Points indicate the power and false positive rate achieved at a threshold of p ≤ 0.05 or for LCV.