
Figure 4 |. Effect size estimates and variant level contribution to CAUSE test statistics for four trait pairs.
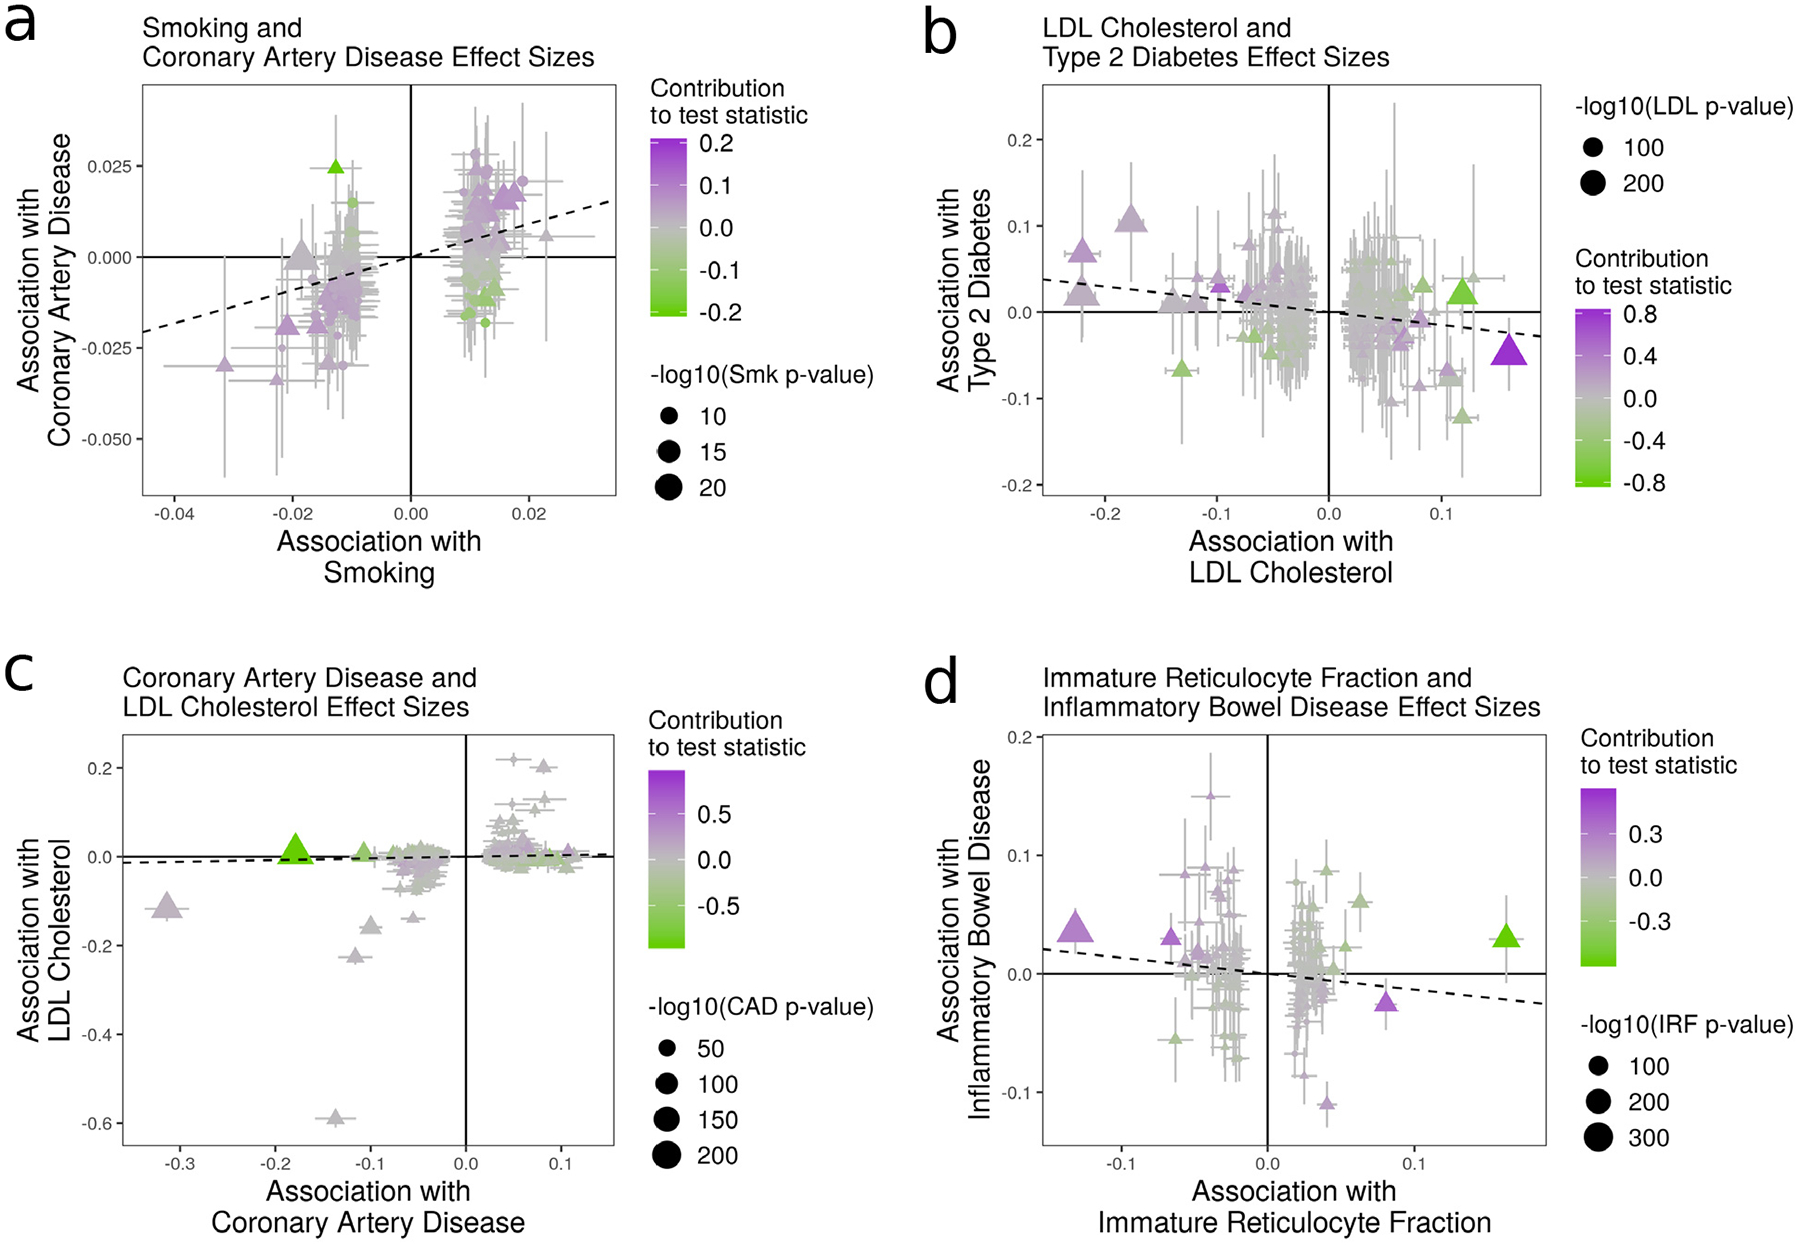
Effect estimates for trait M (horizontal axis) are plotted against estimates for trait Y (vertical axis). Error bars have length 1.96 times the standard error of the estimate. Triangles indicate variants reaching genome-wide significance for trait M (p < 5 · 10−8). Variants with trait M p-value < 5 · 10−6 are shown. Dotted lines show the IVW estimate obtained using only genome-wide significant variants. a, Smoking (M) and CAD (Y). All methods detect evidence of a causal effect. b, LDL (M) and T2D (Y). Only CAUSE does not detect a causal effect. Under the CAUSE model, these data can be explained by a shared factor accounting for 13% of LDL cholesterol effect variants. c, CAD (M) and LDL cholesterol (Y). CAUSE avoids a likely false positive obtained by other methods as a result of a reverse direction effect. Egger regression, the weighted mode, and MR-PRESSO all find a significant effect (see Supplementary Table 5). d, IRF (M) and IBD (Y). MR-PRESSO, the weighted median, and modal estimators obtain a positive result by downweighting or removing variants supplying conflicting evidence.