
Extended Data Fig. 2. Tests for casual effects of risk factors on diseases.
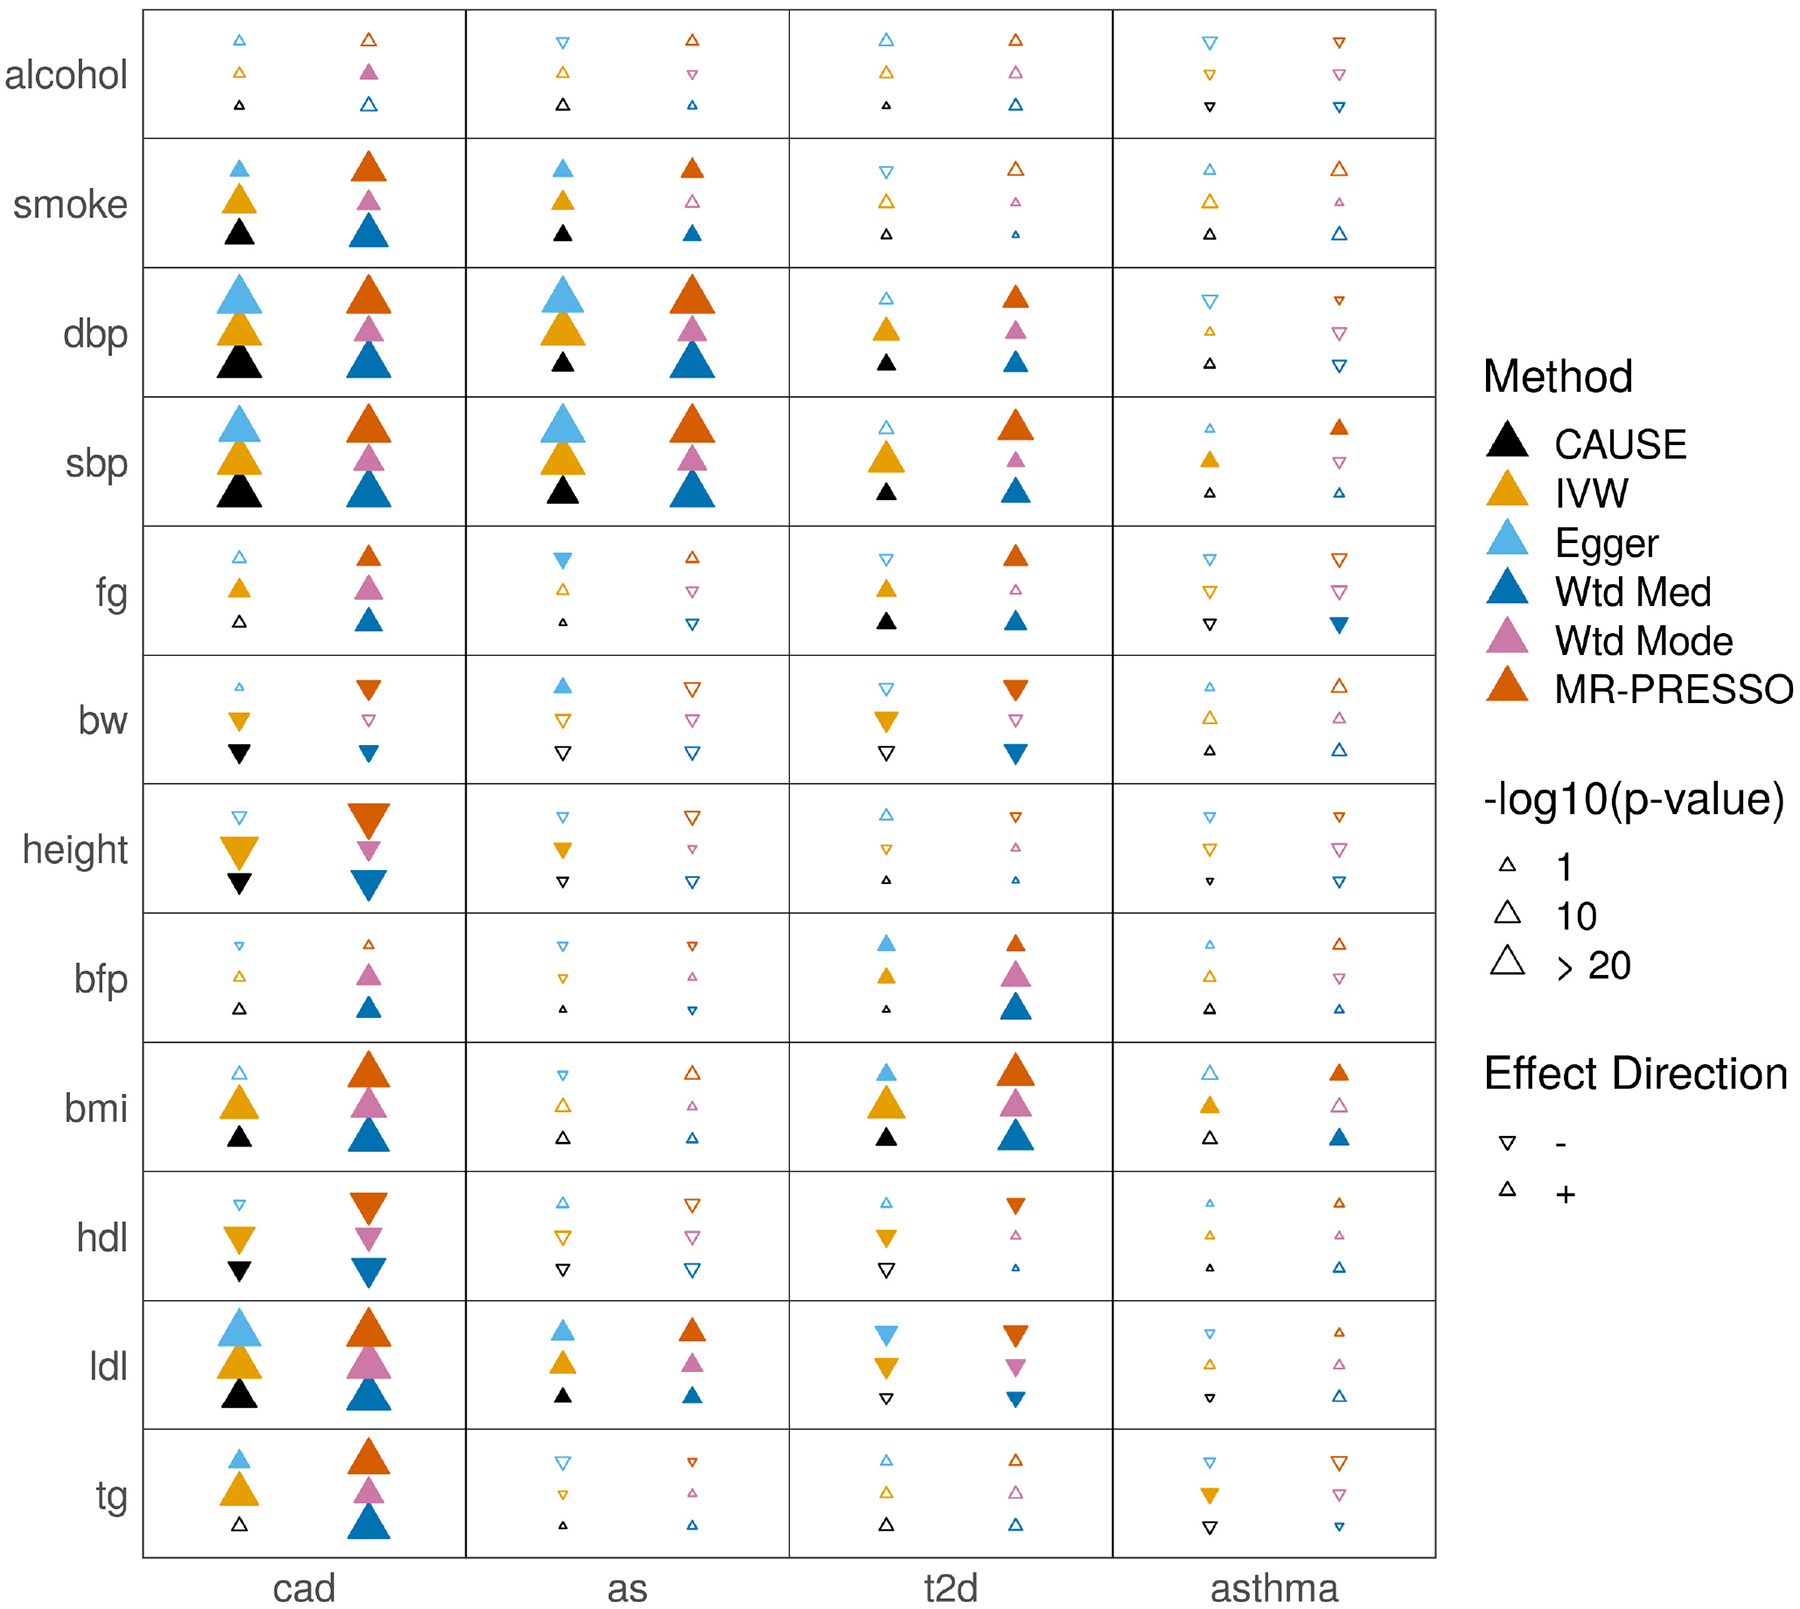
Each cell summarizes the results of six methods for a pair of traits. In the left column of the cell, methods from bottom to top are CAUSE, IVW regression, and Egger regression. In the right column, methods from bottom to top are weighted median, weighted mode, and MR-PRESSO.
Filled symbols indicate a nominally significant p = 0.05.