
Figure 1: Cas9 introduction can activate the p53 pathway.
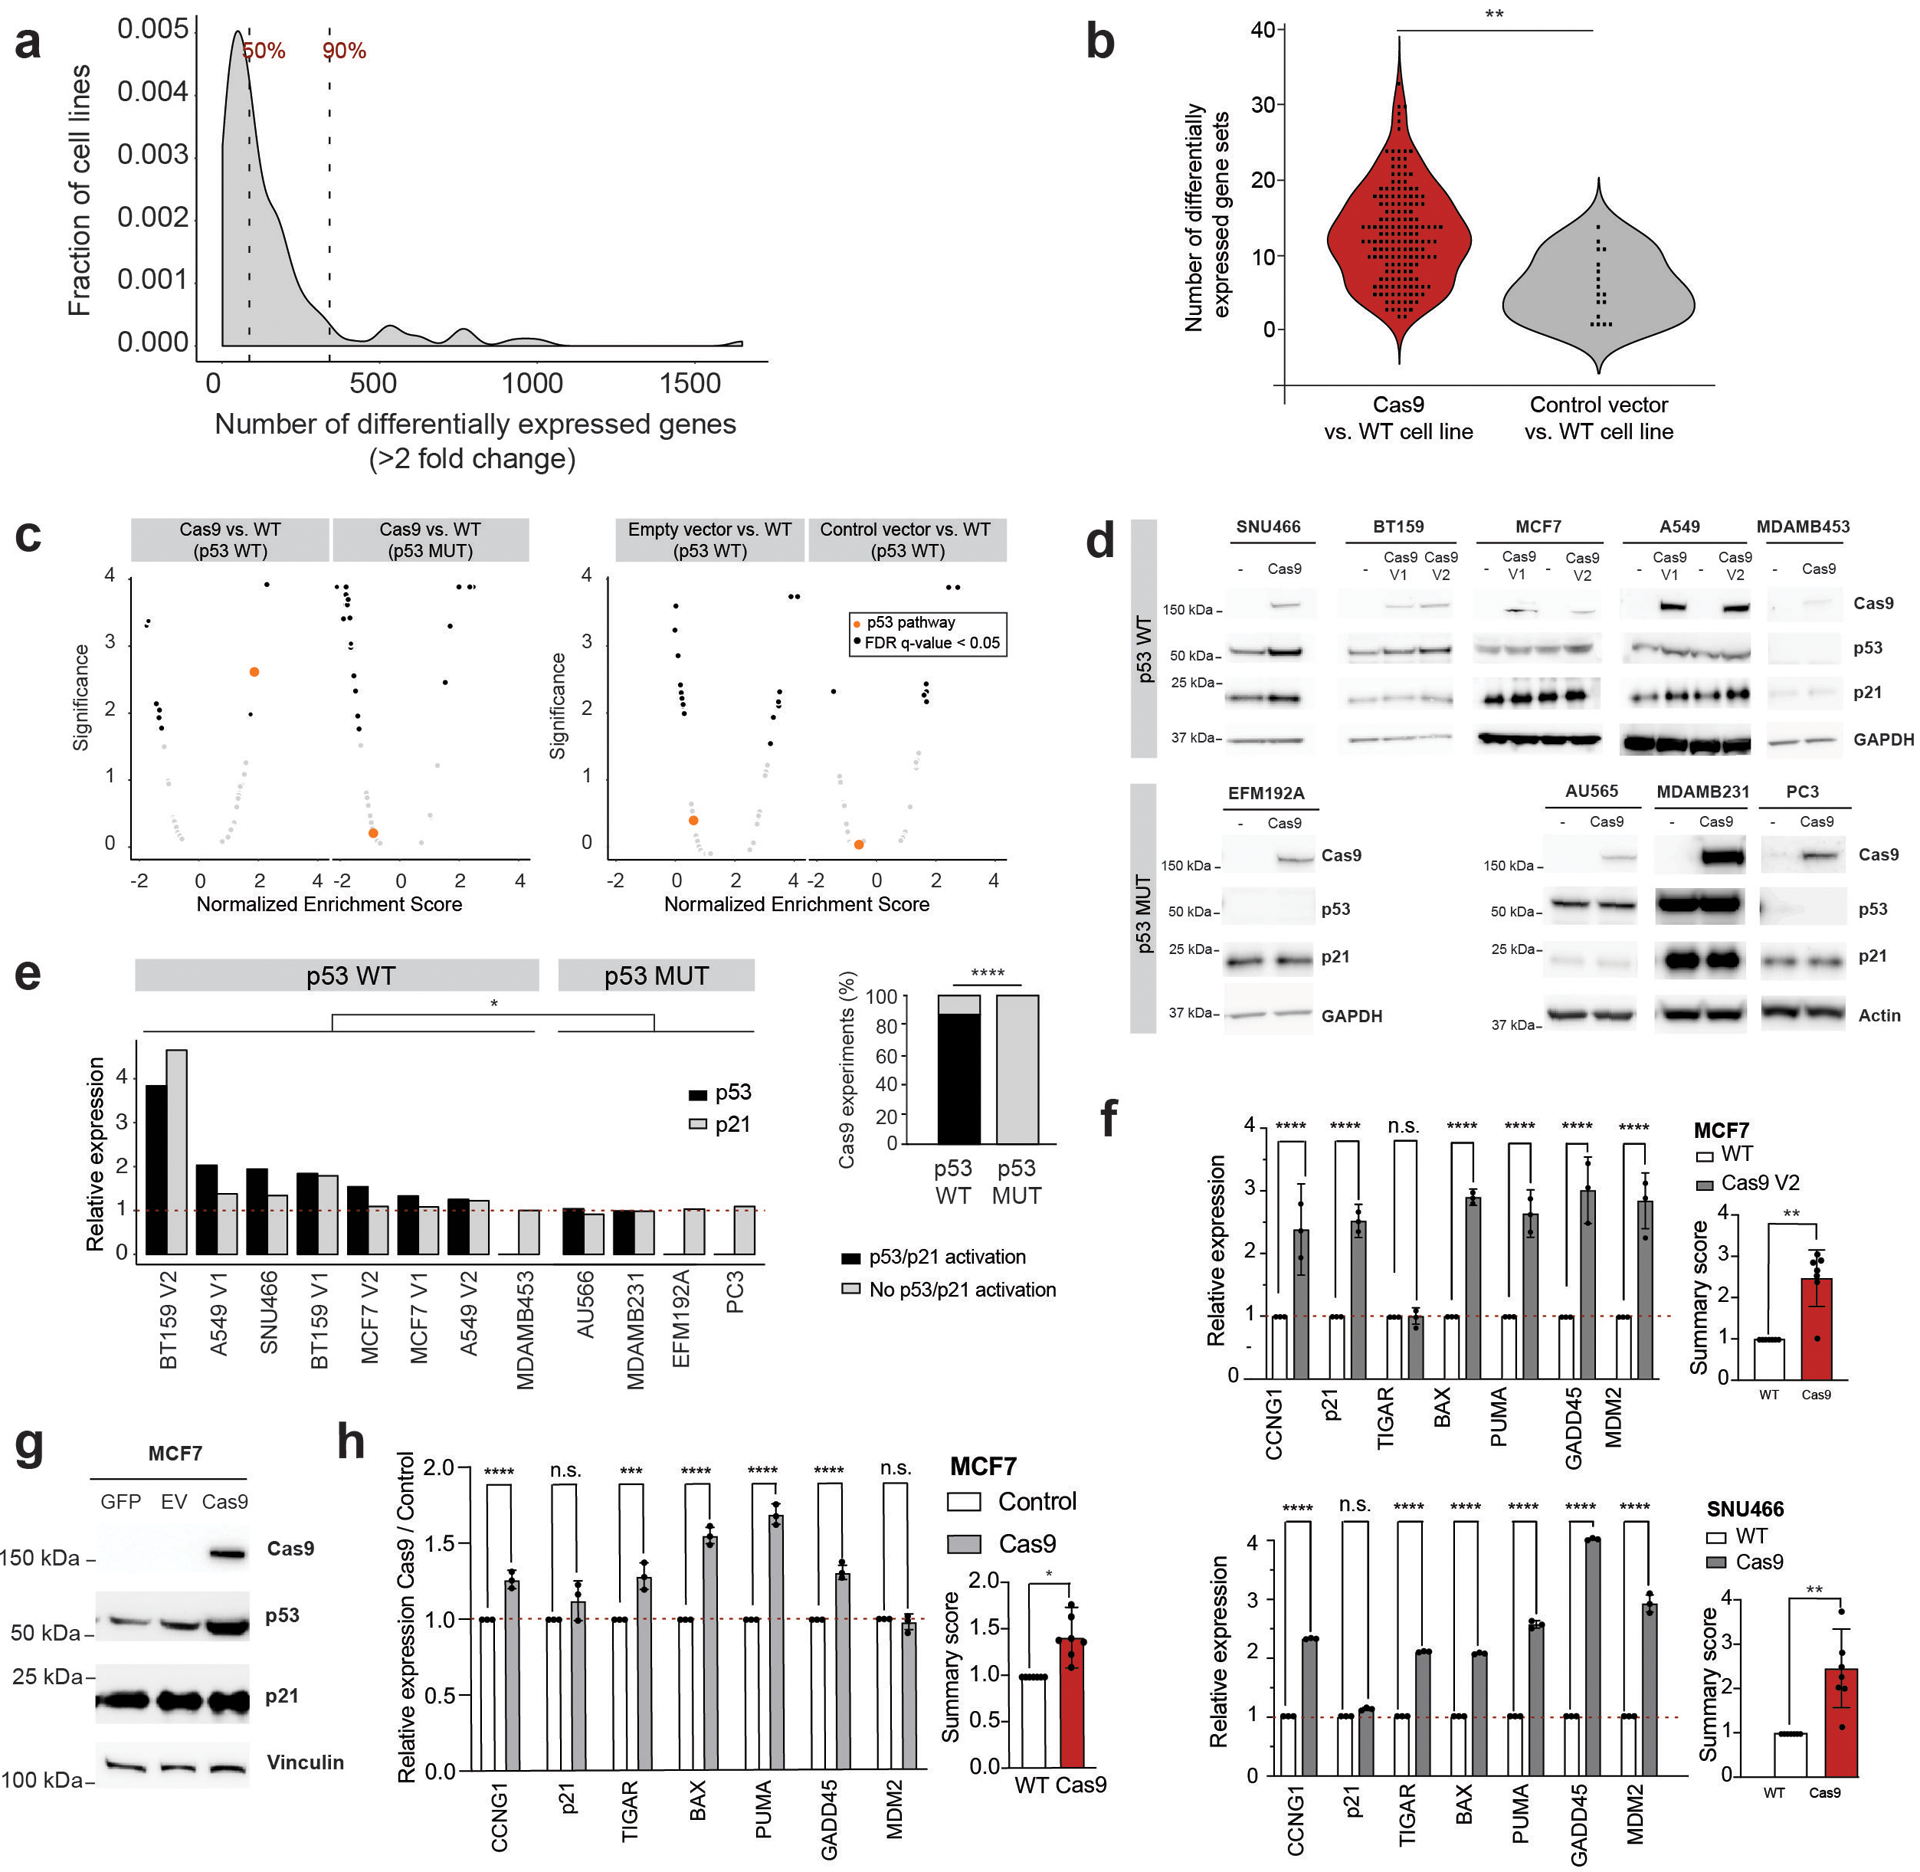
(a) The number of differentially expressed genes (fold change ≥ 2) across 165 Cas9 vs. WT transcriptional signatures. Dashed vertical lines highlight the median (87 genes) and the 90% percentile (389 genes). (b) The number of MSigDB Hallmark biological pathways that are significantly enriched (GSEA enrichment score with multiple hypotheses correction; FDR q < 0.05) following the introduction of Cas9 (red) or empty/control vectors (gray) **, P = 0.001, two-sided Kolmogorov–Smirnov test. Data points represent cell line pairs. (c) The degree and significance of modulation of the 50 MSigDB Hallmark biological pathways, following the introduction of empty vectors, reporter vectors or Cas9 into TP53-WT cell lines, and the introduction of Cas9 into TP53-mutant cell lines. Black, significantly enriched (GSEA enrichment score with multiple hypotheses correction; FDR q < 0.05) pathways. Orange, the p53 pathway. Each plot represents the results of one Aggregate expression signature (see Online Methods). (d) Protein levels of Cas9, p53, p21 and a housekeeping protein in 8 TP53-WT lines and 4 TP53-mutant lines before and after Cas9 introduction. Representative results of 3 independent experiments are shown. (e) Left: WB quantification. Each bar represents a WB shown in (d). *, P = 0.027 and P = 0.024 for p53 and p21, respectively; one-tailed Wilcoxon rank test. Right: The fraction of lines that activated p53 or p21 in response to Cas9 introduction. *, P = 0.01, one-tailed Fisher’s exact test. (f) Left: confirmation of p53 pathway activation in MCF7 and SNU466 by RT-qPCR analysis of 7 p53 transcriptional targets. ****, P < 0.0001, one-tailed t test. Right: the average activation of p53 transcriptional targets. **, P < 0.01, two-sided one-sample t test. (g) Protein levels of Cas9, p53, p21 and a housekeeping protein in MCF7 cells transfected with GFP, Cas9 or a backbone-matched empty vector (EV). Representative results of 3 independent experiments are shown. (h) Left: confirmation of p53 activation in MCF7 cells transfected with Cas9 by RT-qPCR analysis of 7 p53 transcriptional targets. Shown is the relative activation in cells transfected with Cas9 compared to cells transfected with control vectors. ***, P = 0.0002, ****, P < 0.0001, one-tailed t test. Right: the average activation of p53 transcriptional targets. *, P < 0.05, two-sided one-sample t test. For all bar plots: data values, the means of the 7 targets; error bars, S.D.