
Extended Data Fig. 2. Confirmation of p53 activation following Cas9 introduction (related to Figure 1).
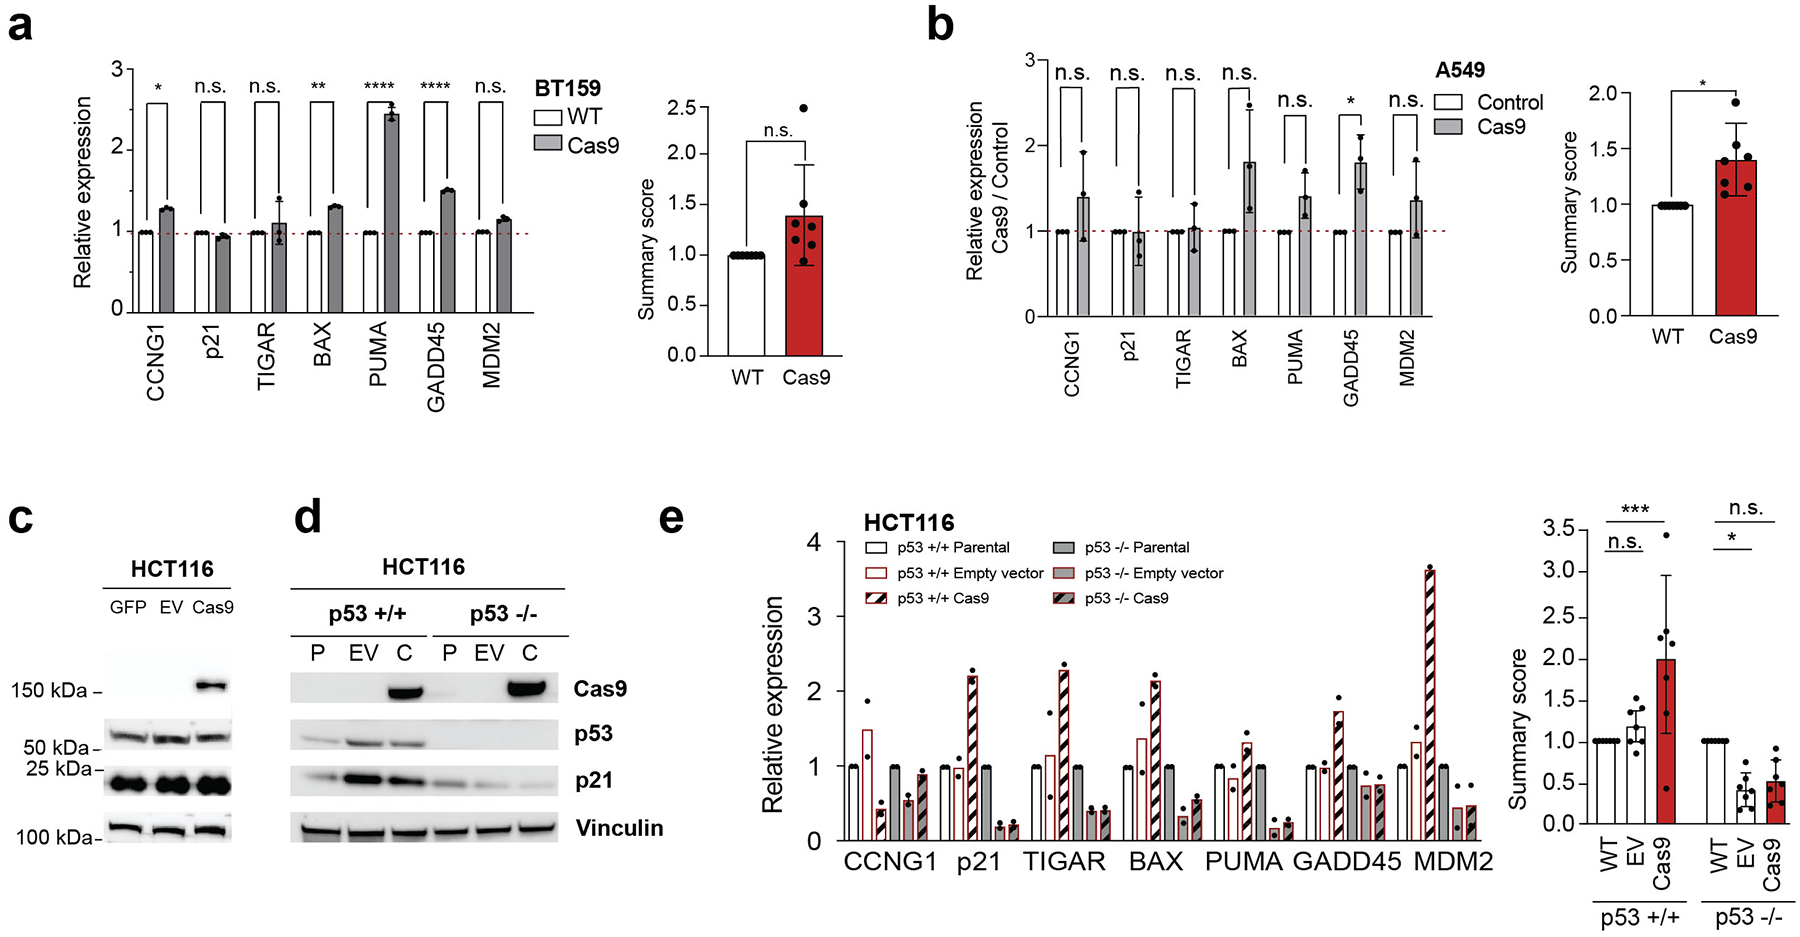
(a) Left: confirmation of p53 pathway activation in BT159 cell lines by RT-qPCR analysis of 7 transcriptional targets of p53. *, P = 0.017, **, P = 0.0065, ****, P < 0.0001, one-tailed t test. Data values represent the means of 3 replicates, with error bars corresponding to S.D. Right: the average activation of p53 transcriptional targets. P = 0.08, two-tailed one-sample t test. Data values represent the means of the 7 targets, with error bars corresponding to S.D. (b) Left: RT-qPCR analysis of 7 transcriptional targets of p53 in A549 (TP53-WT) before and after its transduction with Cas9 or with three control vectors: luciferase, GFP or DNA barcode. *, P = 0.048, one-tailed t test. Data values represent the means of the 3 control vectors and of 3 biological replicates of Cas9, with error bars corresponding to S.D. Right: the average activation of p53 transcriptional targets. *, P < 0.05, two-tailed one-sample t test. Data values represent the means of the 7 targets, with error bars corresponding to S.D. (c) Protein levels of Cas9, p53, p21 and a housekeeping protein in HCT116 cells transfected with GFP, Cas9 or a backbone-matched empty vector (EV). Results represent a single experiment. (d) Protein levels of Cas9, p53, p21 and a housekeeping protein in isogenic TP53-WT (P) and TP53-null HCT116 cells before and after transduction of Cas9 (C) or of a backbone-matched control vector (EV). Results represent a single experiment. (e) Left: RT-qPCR analysis of 7 transcriptional targets of p53 shows p53 pathway activation specifically in the Cas9-expressing TP53-WT HCT116 cells. Data values represent the means of 2 replicates, with error bars corresponding to S.D. Right: the average activation of p53 transcriptional targets. *, P = 0.028, ***, P = 0.0004, ****, P < 0.0001, two-tailed one-sample t test. Data values represent the means of the 7 targets, with error bars corresponding to S.D.