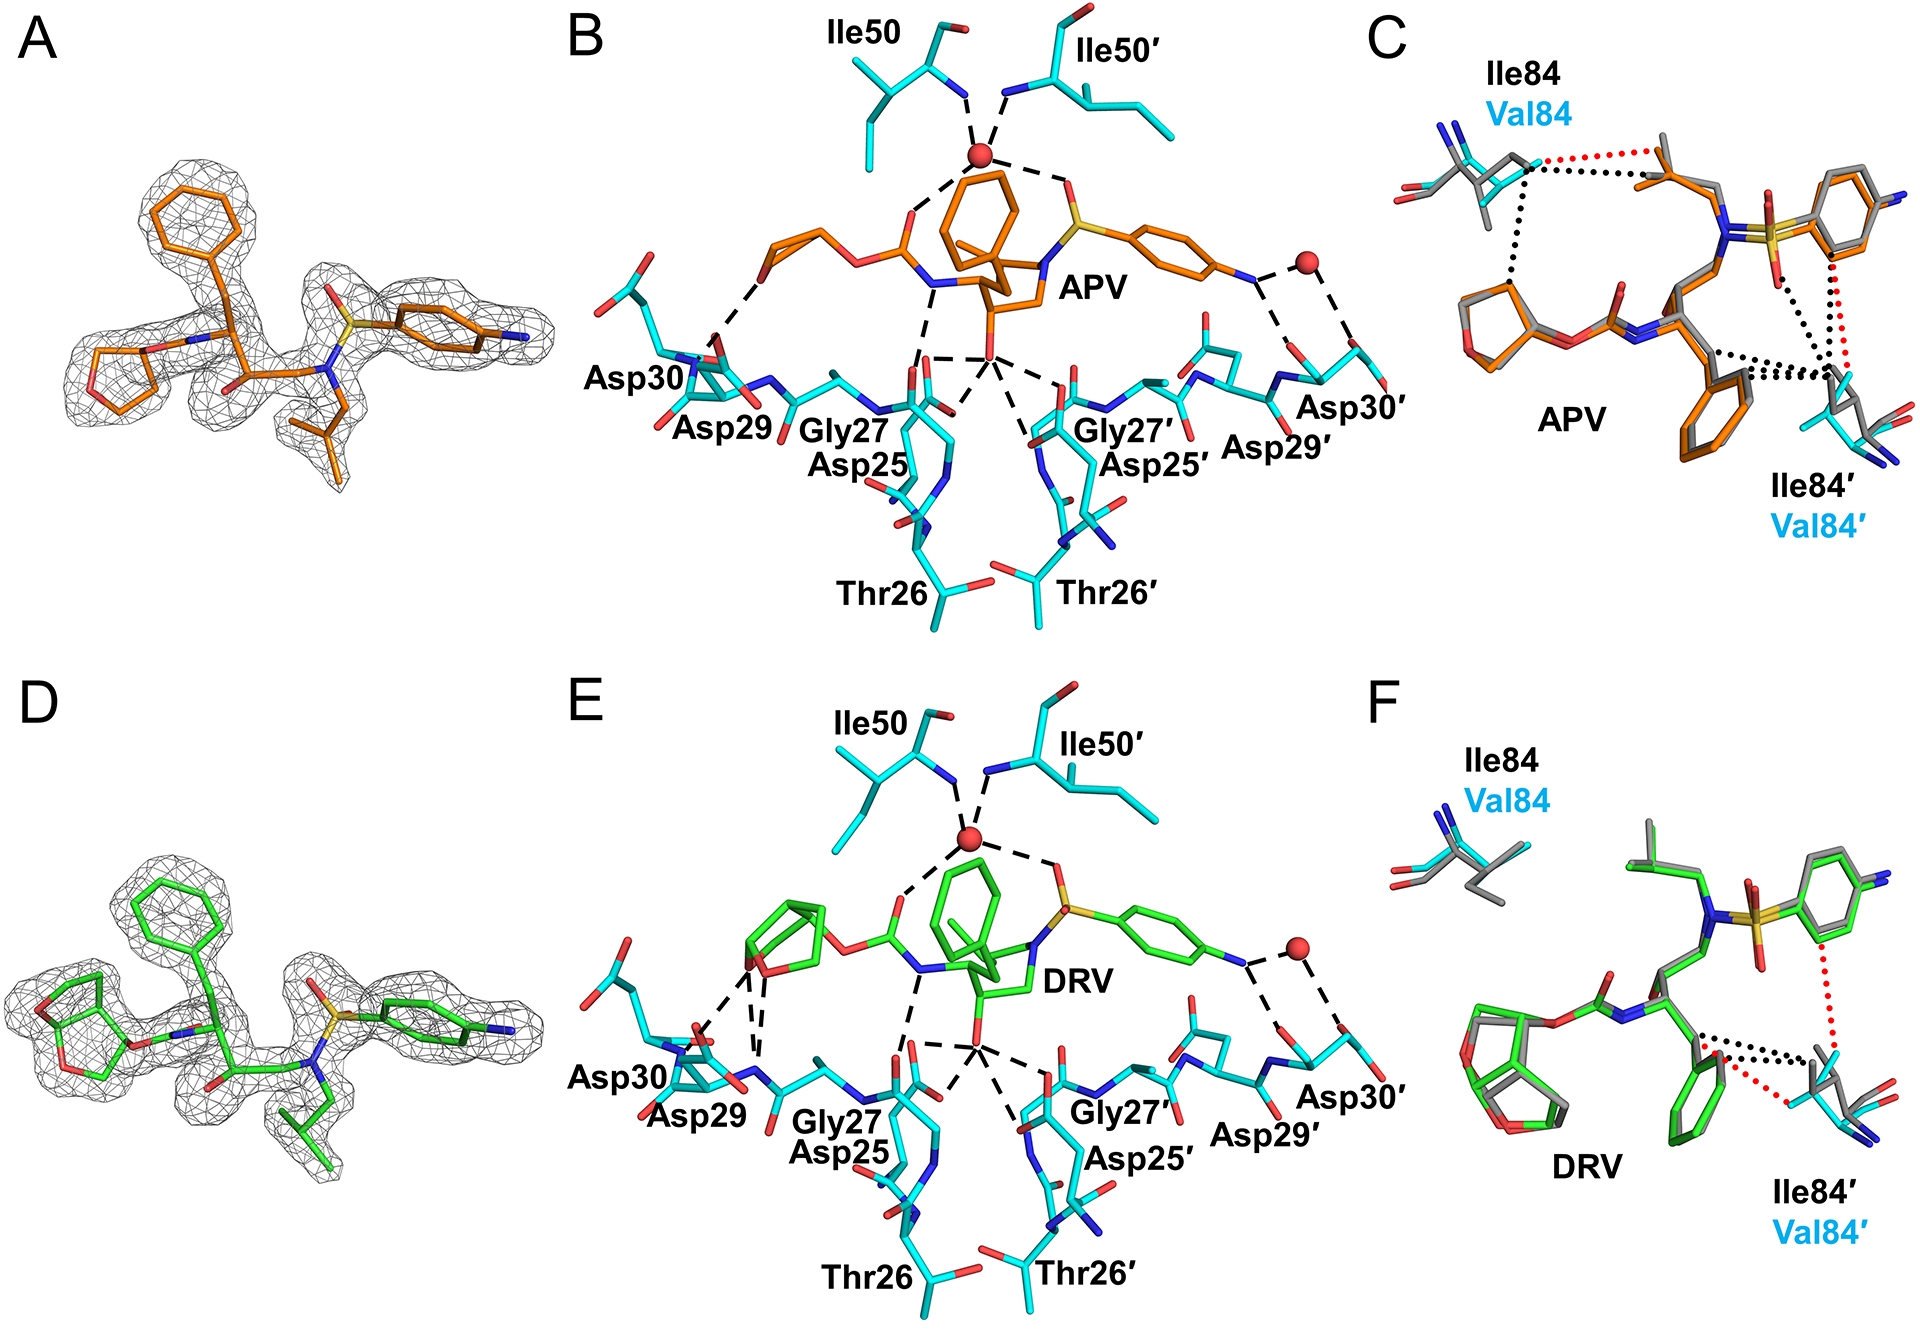
Figure 3: PRS5B interactions with clinical inhibitors APV and DRV.

A. Omit map (grey mesh) for APV (orange sticks) B. APV hydrogen bonds with PRS5B. C. Comparison of van der Waals contacts of I84V with APV in PR and PRS5B. D. Omit map (grey mesh) for DRV (green sticks) E. DRV hydrogen bonds with PRS5B. F. Comparison of van der Waals contacts of I84V with DRV in PR and PRS5B. Omit maps are Fo-Fc maps contoured at 3σ (grey mesh) for APV and DRV. PRS5B residues are shown as cyan sticks. PR/APV and PR/DRV are shown as grey sticks. Water molecules are red spheres. Van der Waals interactions are shown as dotted lines in red and black for PRS5B and PR, respectively. Structure figures were generated using PyMOL.
