
Figure 8: Molecular dynamics simulations of ligand-free PR and PRS5B show conformational variation in the flaps, loops 1 and 2, and termini.
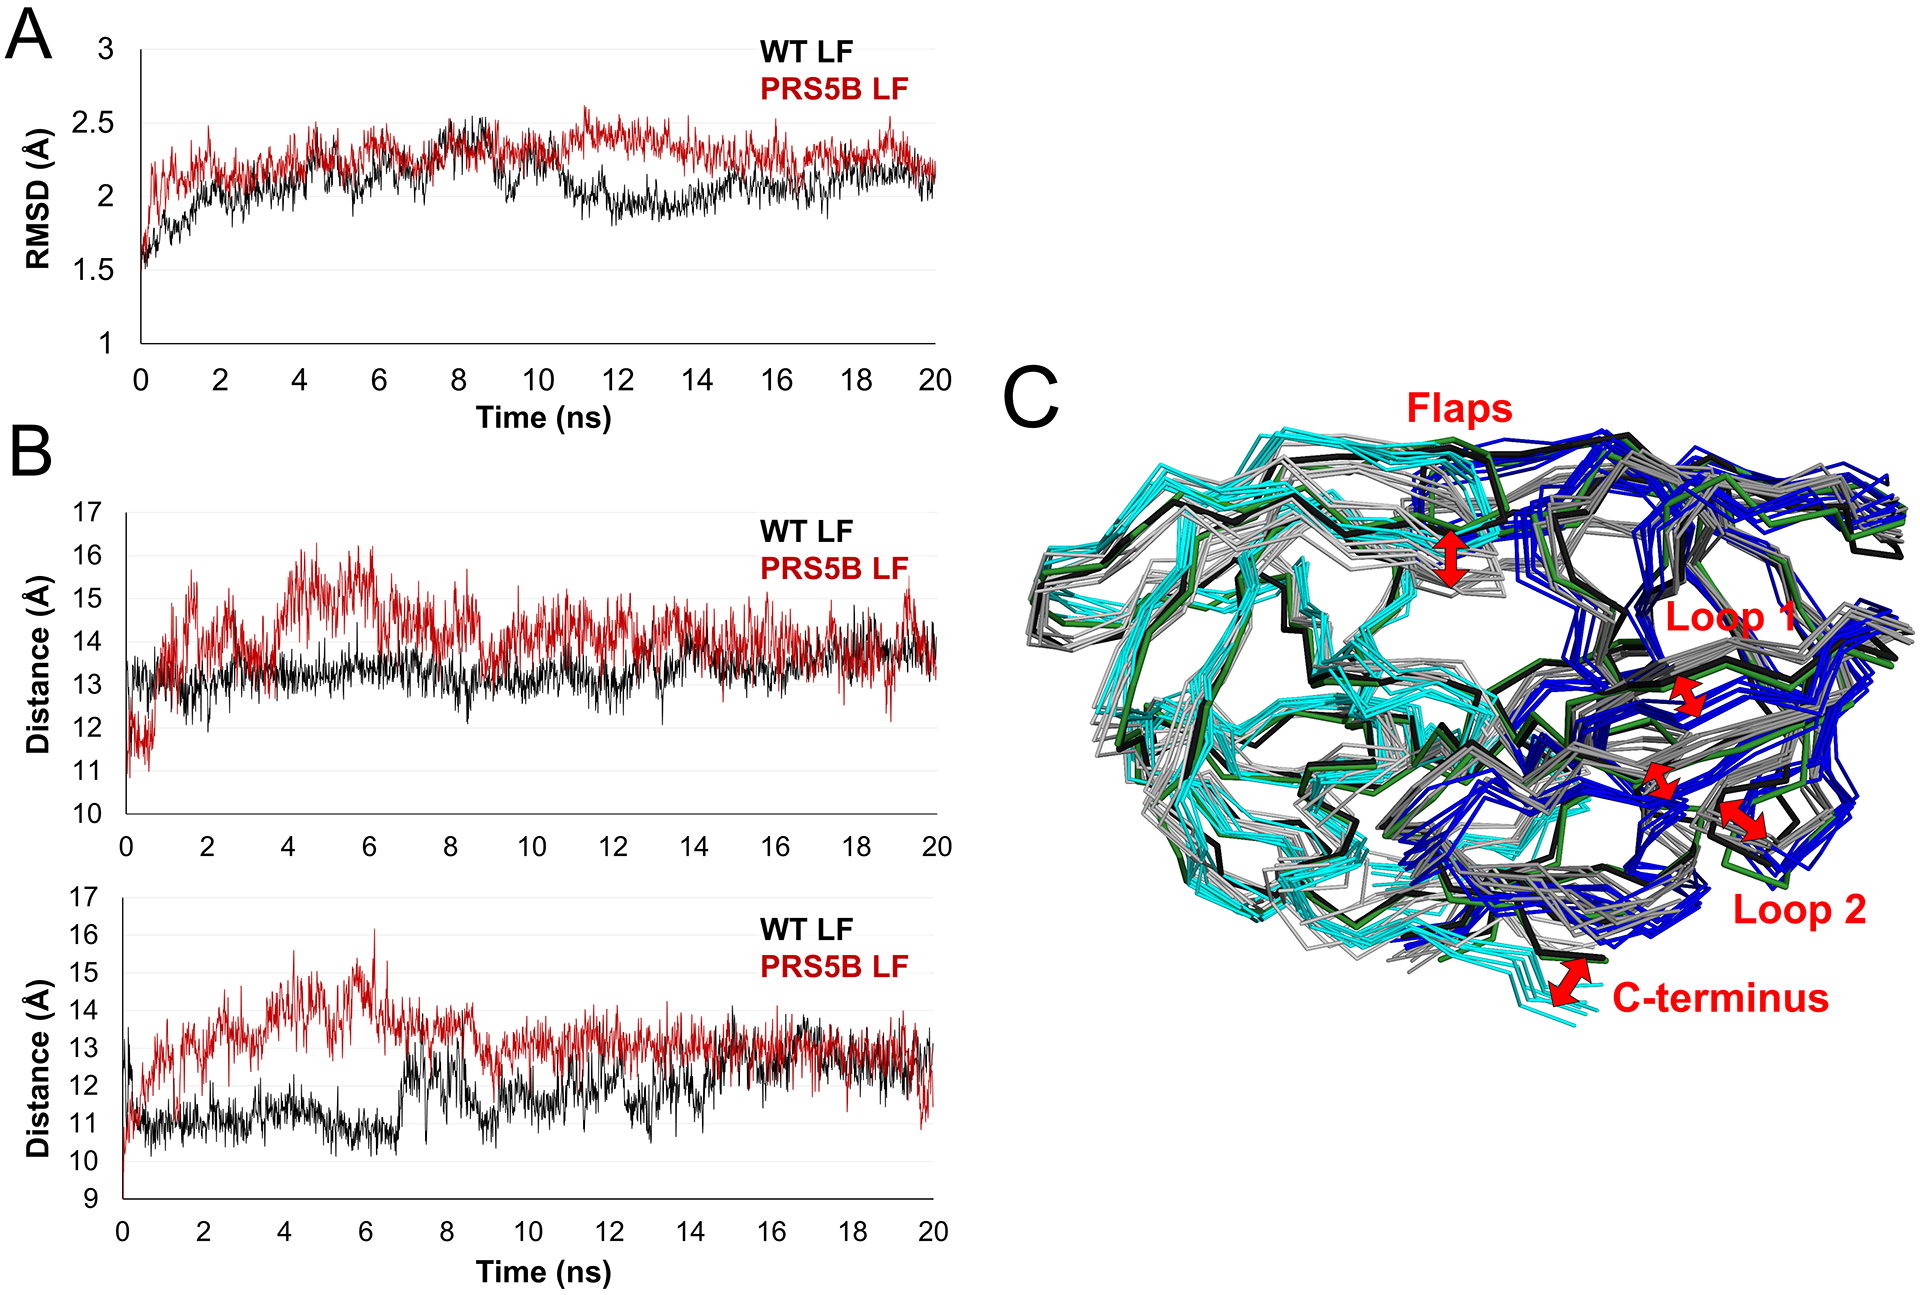
A. Trajectories of the simulations of ligand-free dimers. RMSD of Cα atoms after superposition on the starting crystal structure plotted for the 20 ns time course. PRS5B LF and PR LF simulations are colored in red and black respectively.
B. Distance between Cα atoms of the flap tip (Ile50) and the catalytic Asp25 for subunit A (top) and subunit B (bottom) for the time course of the simulation. Plots are colored as in A.
C. Comparison of PR and PRS5B ligand-free simulations. Snapshots of PR (grey shades) and PRS5B (cyan and blue) models for every 3 ns of the simulation shown as superimposed ribbons. The starting crystal structures of PR (black) and PRS5B (green) are shown. Labeled regions and red arrows indicate large conformational differences between wild-type and mutant protease. Structure figures were generated using PyMOL.