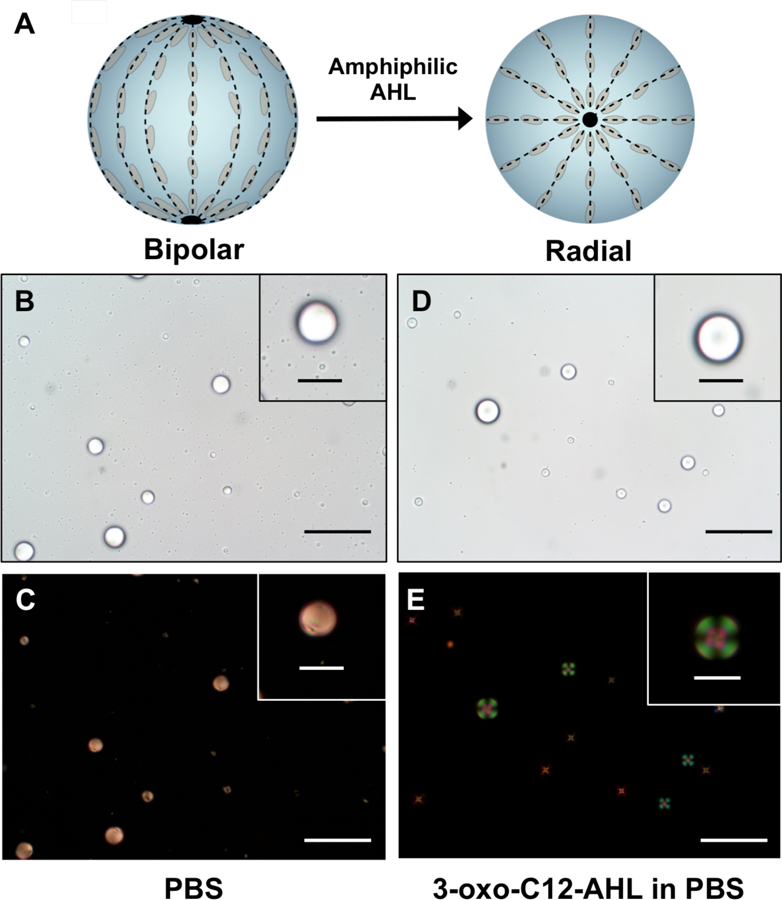
Figure 2.

A) Schematic of the LC director profiles (dotted lines) for spherical LC droplets in the bipolar (left) and radial (right) states. Black points represent characteristic defects associated with each state. B-C and D-E show bright-field (B, D) and polarized-light (C, E) micrographs of 5CB droplets in the bipolar (B-C) and radial (D-E) states. B-C) Images of LC droplets dispersed in PBS. D-E) Images of LC droplets dispersed in PBS after the addition of 3-oxo-C12 AHL (50 μM). Droplets in (C) and (E) were imaged using crossed polarizers oriented parallel to the 30 μm scale bars in the main image (scale bars = 10 μm for insets).
