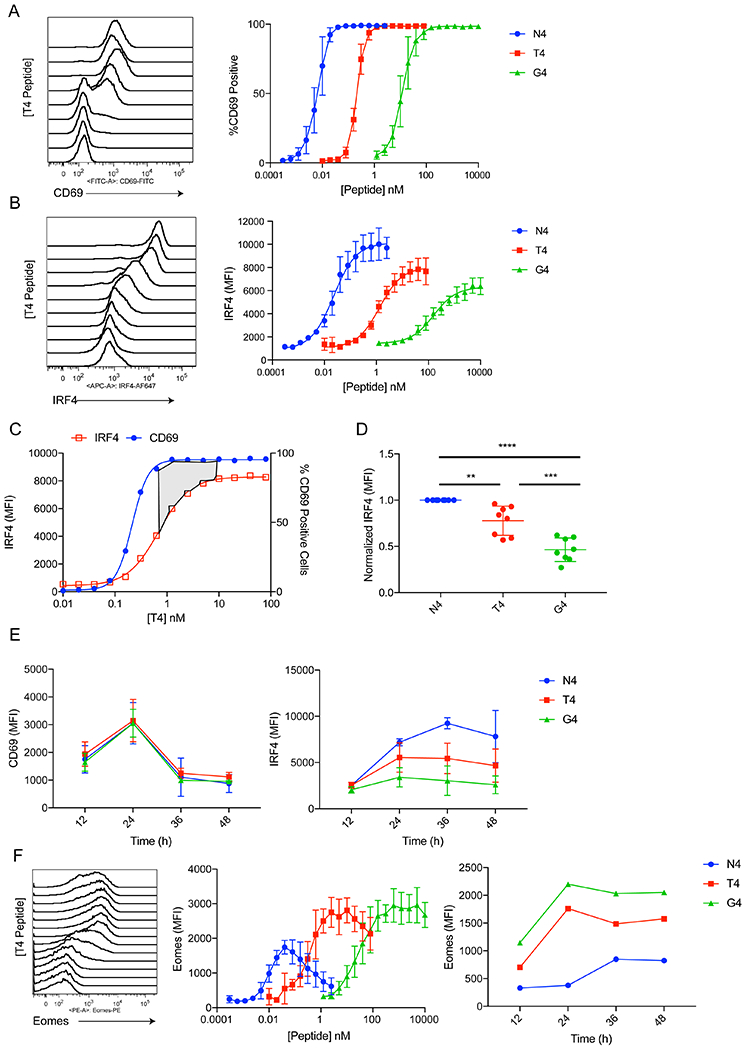
Figure 1. CD69 and IRF4 respond differently to graded TCR signaling in activated CD8+ T cells.

(A) Representative histogram plots of CD69 staining on OT-I cells stimulated with different doses of T4 peptide for 24h. Cells were gated on live CD8+ TCRβ+. Plots of %CD69+ values are shown for all three peptides at right.
(B) Representative histogram plots of IRF4 intracellular staining in OT-I cells stimulated with different doses of T4 peptide for 24h. Cells were gated on live CD8+ TCRβ+. Plots of IRF4 MFI values are shown for all three peptides at right.
(C) IRF4 MFI and %CD69+ values for the T4 peptide dose response were plotted on the same graph. The area shaded in gray emphasizes the concentration of antigen that yields maximum CD69 expression but is still on the upslope for IRF4 expression.
(D) IRF4 MFI values were normalized to N4 stimulation over multiple experiments. These data show results of stimulations with 1nM N4, 100nM T4, and 1μM G4, which are the relative concentrations eliciting maximum IRF4 expression for each peptide. ** p≤0.01, *** p≤0.001, **** p≤0.0001 (one-way ANOVA followed by Dunnett’s test for N4 comparisons. Unpaired student t test for T4 and G4 comparison)
(E) OT-I T cells were stimulated for 12-48h with 1nM N4, 100nM T4, or 1μM G4. MFI values for CD69 (left) and IRF4 (right) are plotted over time.
(F) OT-I cells were treated with varying doses of N4, T4, or G4 peptides for 24h. Representative histograms of Eomes intracellular staining are shown for the T4 peptide (left). Eomes MFI is plotted for each peptide dose (middle). Cells were treated with 1nM N4, 100nM T4, or 1μM G4 from 12-48h and MFI for each peptide is plotted over time.
Data are representative of three to five experiments.
