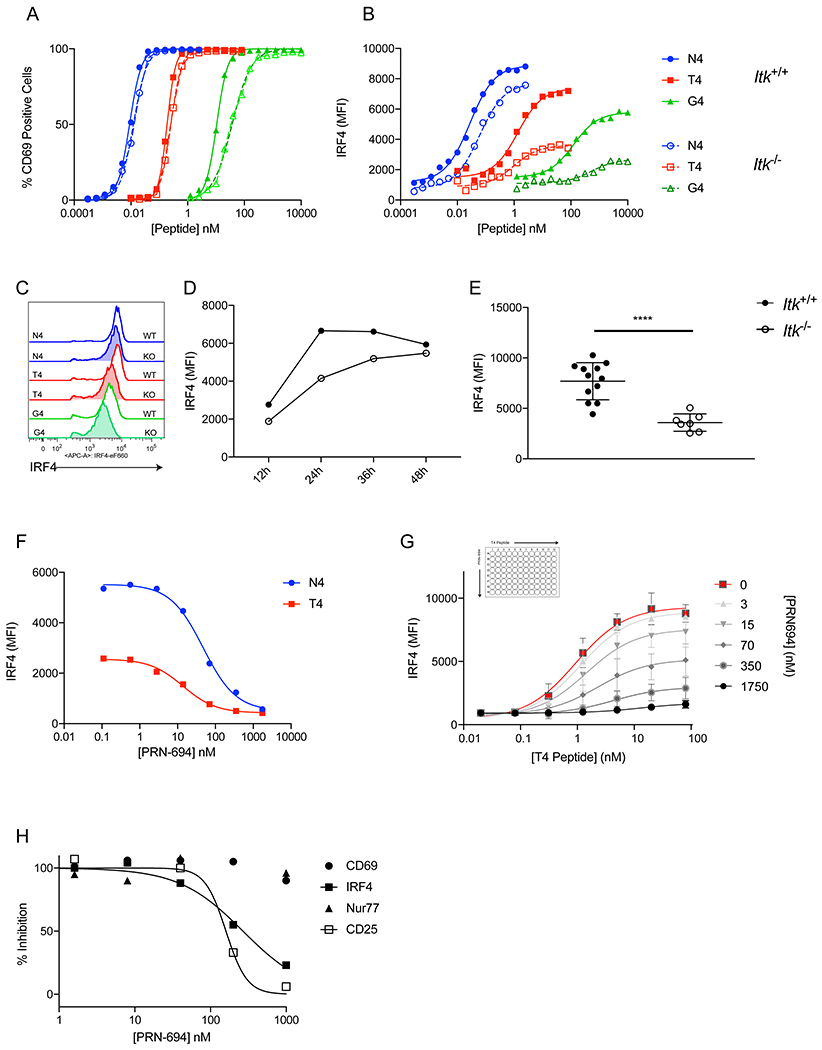
Figure 2. ITK inhibition reduces maximum IRF4 expression in CD8+ T cells in a graded manner.

(A-B) OT-I WT (Itk+/+) or OT-I Itk−/− (Itk−/−) T cells were stimulated each peptide for 24h at multiple doses. %CD69+ (A) and IRF4 MFI (B) are plotted for each peptide concentration.
(C) Representative histograms of IRF4 intracellular staining for 1nM N4, 100nM T4, and 1μM G4 peptide stimulations of Itk+/+ or Itk−/− cells.
(D) Itk+/+ or Itk−/− OT-I cells were stimulated with 100nM T4 peptide at timepoints from 12-48h, and IRF4 MFI is plotted.
(E) IRF4 MFI values of Itk+/+ or Itk−/− cells stimulated with 100nM T4 for 24h. **** p≤0.0001 (unpaired student t test)
(F) OT-I T cells were stimulated with 1nM N4 and 100nM T4 peptide while simultaneously treated with varying doses of the ITK/RLK inhibitor PRN694 for 24h. Cells were stained for intracellular IRF4 and MFI of IRF4 staining under each condition is displayed.
(G) OT-I T cells were stimulated with a range of doses of T4 peptide in a matrix using varying doses of PRN694. After 24h the cells were stained for IRF4, and the IRF4 MFI for each condition is displayed. Each curve represents a dose response of T4 peptide at a single concentration of PRN694.
(H) OT-I T cells were stimulated with 100nM T4 peptide with varying doses of PRN694 for 24h. The cells were stained for IRF4, CD69, and CD25. For Nur77, the Nur77-GFP reporter was used. The MFI values were normalized to a positive and negative control to obtain % Inhibition.
Data are representative of three to five experiments.
