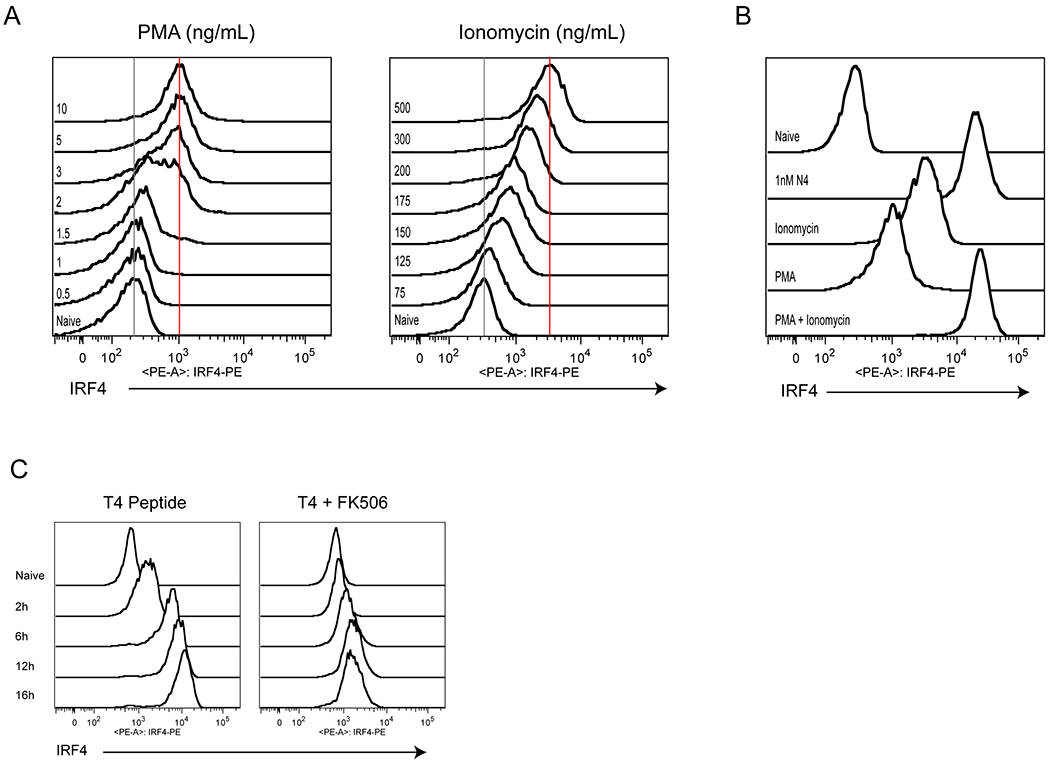
Figure 3. Calcium and calcineurin signaling drives graded IRF4 expression in CD8+ T cells.

(A) OT-I T cells were treated with varying doses of PMA or Ionomycin for 24h, and cells were stained for intracellular IRF4. Representative histograms of IRF4 staining are shown.
(B) Representative histograms of IRF4 staining for OT-I cells left unstimulated (Naïve), or stimulated with 500ng/mL Ionomycin, 10ng/mL PMA, a combination of both, or 1nM N4 for 24h.
(C) Representative histograms of IRF4 staining for OT-I cells treated with 100nM T4 for timepoints from 2-16h in the absence (left) or presence (right) of 100nM FK506.
Data are representative of three experiments.
