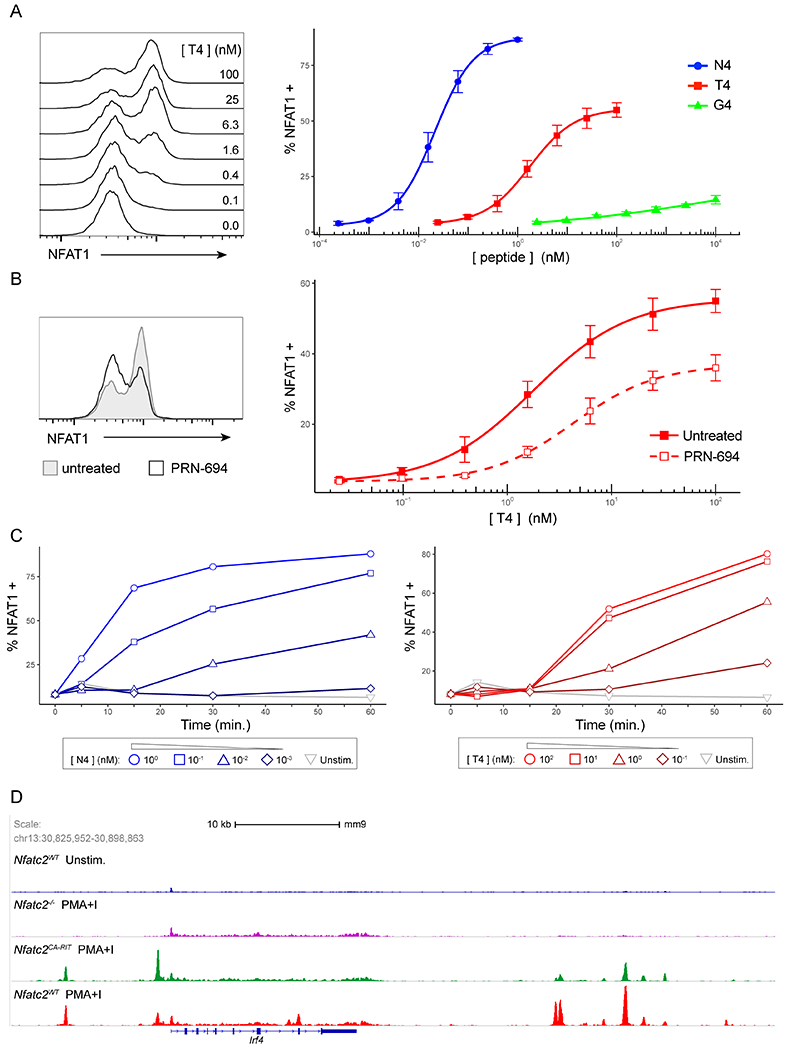
Figure 4. TCR signal strength and ITK activity drives digital NFAT activation in CD8+ T cells.

(A) Representative histograms of NFAT1 fluorescence in OT-I nuclei isolated after T cells were stimulated with B6 splenocytes pulsed with indicated doses of T4 peptide for 30m (left). Line plots of %NFAT1+ nuclei after 30m of stimulation with B6 splenocytes pulsed with indicated doses of either N4, T4 and G4 peptides (right). OT-I nuclei were identified as CellTrace Violet+ events.
(B) Representative histograms of NFAT1 fluorescence in OT-I nuclei after cells were stimulated for 30m with B6 splenocytes pulsed with 25 nM T4 peptide with or without 50nM PRN694 treatment (left). Line plots of %NFAT1+ (nuclear NFAT) values are shown for the T4 peptide dose response with and without 50nM PRN694 treatment (right). Nuclei were gated on CellTrace Violet+ events.
(C) Line plots of %NFAT1+ OT-I nuclei over a 60m timecourse after cells were stimulated B6 splenocytes pulsed with varying doses of either N4 (left) or T4 (right) peptides as indicated.
(D) NFAT1 ChIP-Seq data (GSE64409) on activated CD8 T cells from Martinez et al (21) were visualized using IGV software and a snapshot was taken of the Irf4 locus. The data represents 4 samples: (1) WT T cells, transduced with Mock construct, unstimulated (2) Nfatc2−/− T cells, transduced with Mock construct, stimulated with PMA/Ionomycin for 1h (3) Nfatc2−/− T cells, transduced with CA-RIT-NFAT (constitutively active NFAT unable to bind AP-1), stimulated with PMA/Ionomycin for 1h (4) WT T cells, transduced with Mock construct, stimulated with PMA/Ionomycin for 1h.
Data are representative of three or five experiments.
