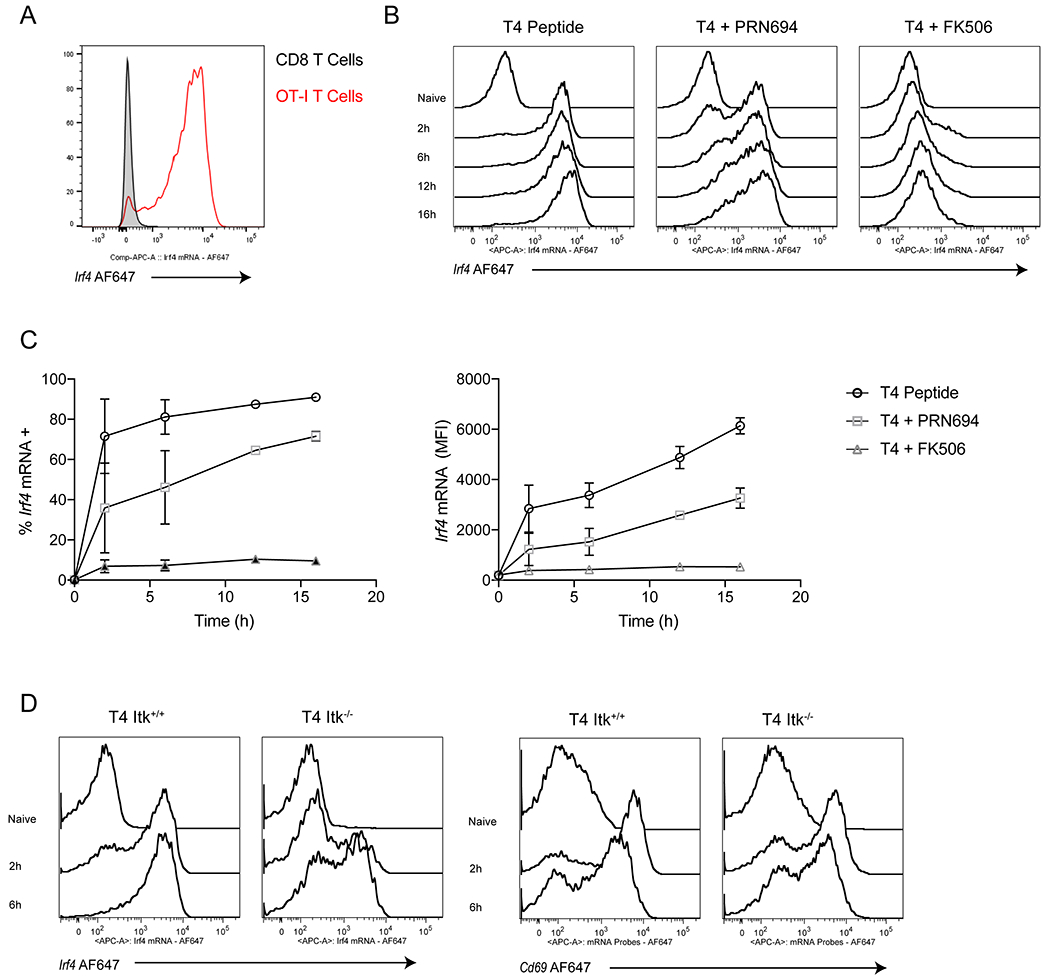
Figure 5. Reducing TCR strength, through ITK inhibition, delays Irf4 mRNA upregulation.

(A) OT-I T cells were labeled with CellTraceViolet and combined 5:1 with unlabeled peptide-pulsed APCs from B6 splenocytes. Representative histograms plots of Irf4 mRNA expression after 16h of 100nM T4 peptide stimulation. Cells are gates on live CD8+ TCRβ+ cells (+CellTraceViolet from OT-I mice and –CellTraceViolet from B6 mice.)
(B-C) OT-I T cells were treated with 100nM T4 peptide for timepoints from 2-16h either alone or in the presence of 100nM PRN694 or 100nM FK506. (A) Representative histogram plots of Irf4 mRNA expression. (B) Data are plotted as %Irf4 mRNA positive (left) or as Irf4 mRNA MFI (right) over time. Cells are gates on live CD8+ TCRβ+ CellTraceViolet+ cells
(C) Itk+/+ or Itk−/− cells OT-I T cells were treated with 100nM T4 peptide for 2 or 6h. Representative histograms for Irf4 and Cd69 mRNA expression are shown. Cells are gates on live CD8+ TCRβ+ CellTraceViolet+ cells
Data are representative of three experiments.
