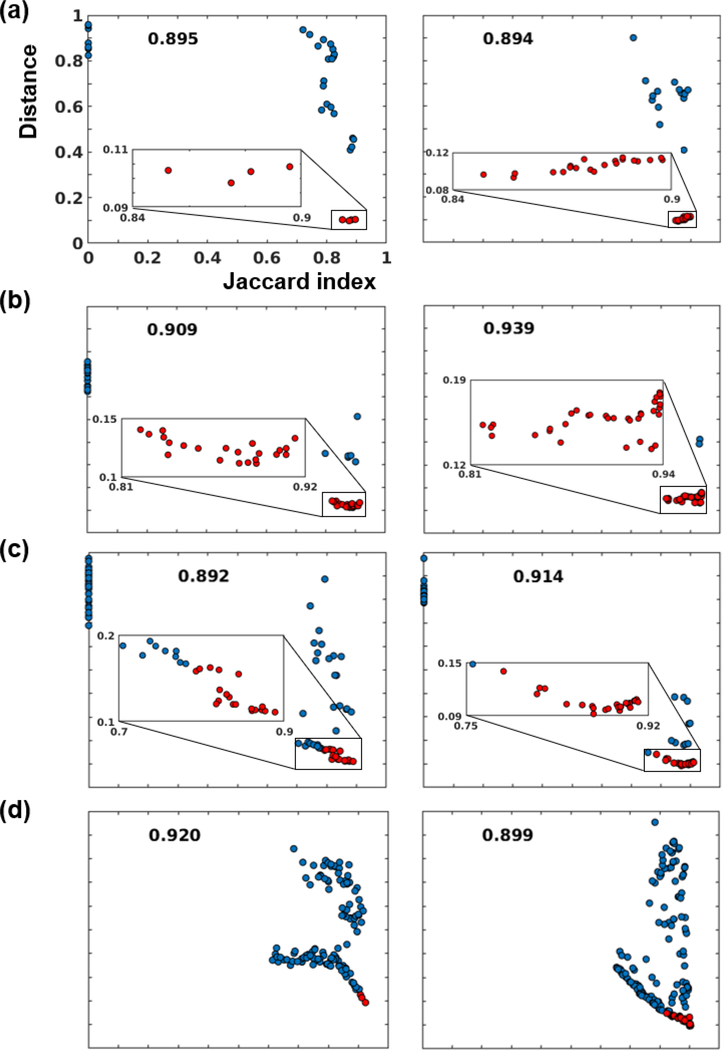
Fig 6.
The relationship between the Jaccard index and shape descriptor distance. Each subplot indicates MSERs from an image. (a), (b), (c), and (d) are two samples from dataset D1, D2, D3, D4, respectively. Red dots indicate selected MSERs to be merged into the final brain mask. The Jaccard indices of final brain masks were labeled at the top of each subplot.

