
Figure 1. Disruption of CHRNA2 signaling in adipose tissue.
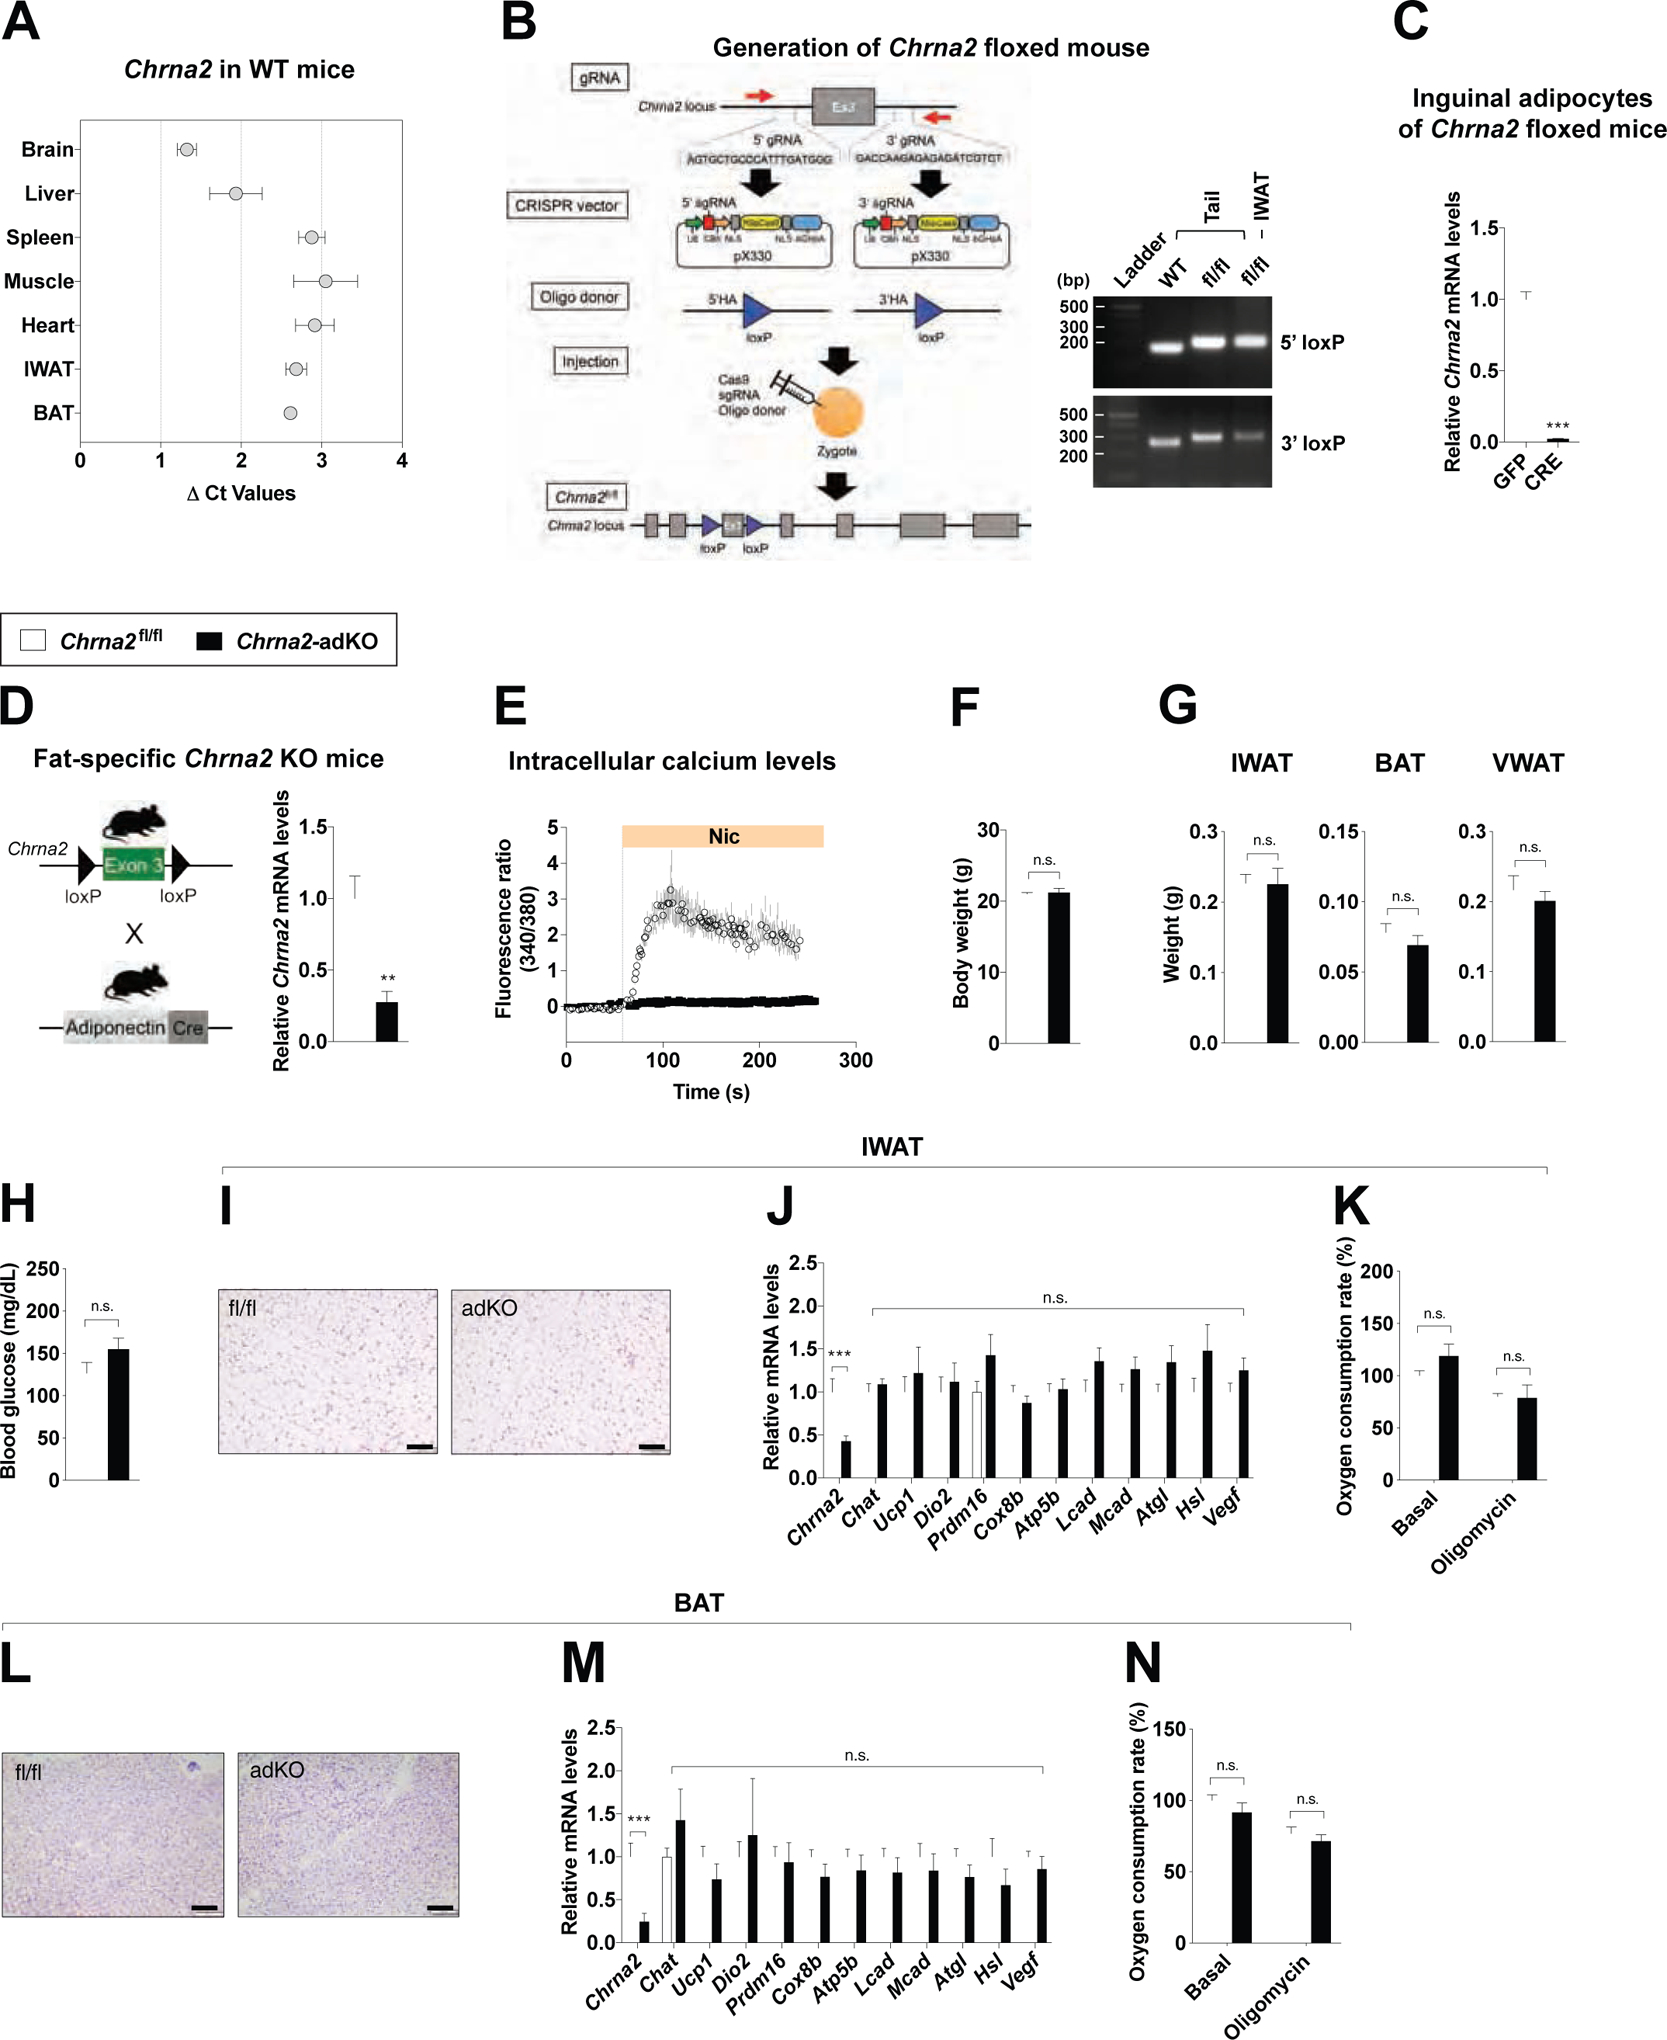
(A) qPCR analyses of Chrna2 mRNA expression across tissues from WT mice (ΔCt relative to Tbp, n = 4).
(B) Generation of floxed mice for the conditional deletion of the Chrna2 gene using the CRISPR/Cas9 system. Exon 3 of the Chrna2 gene was targeted by sgRNAs designed complementary to intronic sequences flanking the exon, then LoxP sites with a 5’ and 3’ HA were introduced by DNA donor oligonucleotides. The generated sgRNAs, donor oligos and Cas9 mRNA targeting Chrna2 were co-injected into zygotes (left). PCR analyses of floxed alleles at the targeted Chrna2 locus in genomic DNA extracted from the tails and IWAT of WT and Chrna2fl/fl mice (right).
(C) qPCR analyses of Chrna2 mRNA expression in differentiated primary inguinal preadipocytes of Chrna2fl/fl mice after transduction with adenoviral GFP or Cre recombinase (n = 6).
(D) Breeding strategy for the generation of adipose-specific Chrna2 knockout mice (Chrna2-adKO) (left). qPCR analyses of Chrna2 mRNA expression in IWAT from Chrna2fl/fl and Chrna2-adKO mice (n = 8 for fl/fl and 4 for adKO) (right).
(E) Intracellular calcium levels following stimulation with the CHRNA2 agonist nicotine (Nic, 500 μM) in differentiated primary inguinal preadipocytes from Chrna2fl/fl (n = 8) and Chrna2-adKO mice (n = 11).
(F and G) Body (F) and adipose tissue (G) weights of Chrna2fl/fl (n = 8) and Chrna2-adKO (n = 4) mice housed at room temperature on a chow diet.
(H) Fasting (4 h) blood glucose levels of Chrna2fl/fl (n = 4) and Chrna2-adKO (n = 5) mice.
(I-K) Representative H&E-stained images (I), qPCR analyses (n = 14 for fl/fl and 20 for adKO) (J), and basal and oligomycin-insensitive oxygen consumption rate (n = 6) (K) of IWAT from Chrna2fl/fl and Chrna2-adKO mice. Scale bar, 100 μm.
(L-N) Representative H&E-stained images (L), qPCR analyses (n = 11 for fl/fl and 8 for adKO) (M), and basal and oligomycin-insensitive oxygen consumption rate (n = 6) (N) of BAT from Chrna2fl/fl and Chrna2-adKO mice. Scale bar, 100 μm.
Data are presented as mean ± SEM. **p < 0.01, ***p < 0.005 by an unpaired two sample Student’s t-test for two-group comparisons. n.s., not significant (p > 0.1). See also Figure S1.