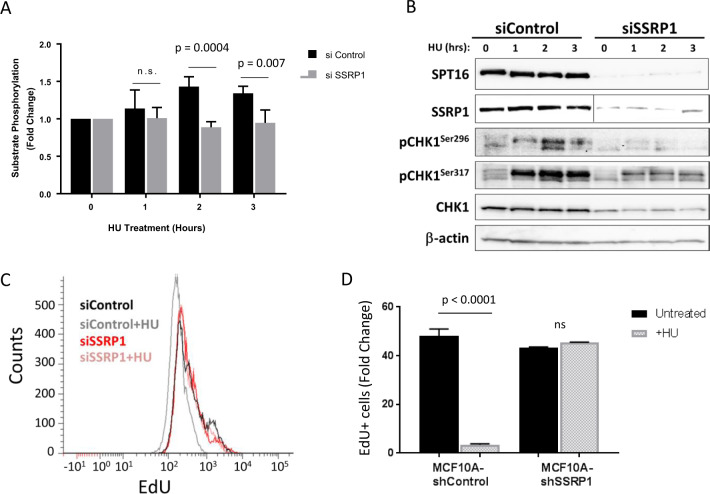
Fig. 4. FACT-depleted cells show a loss of ATR/CHK1 activation in response to replication stress.
a Quantitation of phospho-(Ser/Thr) ATM/ATR substrate levels in lysates from MCF10A cells transfected with the indicated siRNA and incubated in the presence or absence of 2.5 mM HU for the indicated times. The intensities of the four substrate bands of interest were quantified using ImageJ. Bars indicate the mean intensity ± SD. b Immunoblotting of MCF10A cell lysates following treatment with 2.5 mM HU for the indicated time points. c, d EdU incorporation in MCF10A cells 72 h post-transfection with the indicated siRNA and treatment with 2.5 mM HU for 12 h. EdU was added for the last 30 min. c Histograms of EdU intensity distribution. d Percentage of EdU+ cells. Data are presented as the mean ± SD (n = 2).

