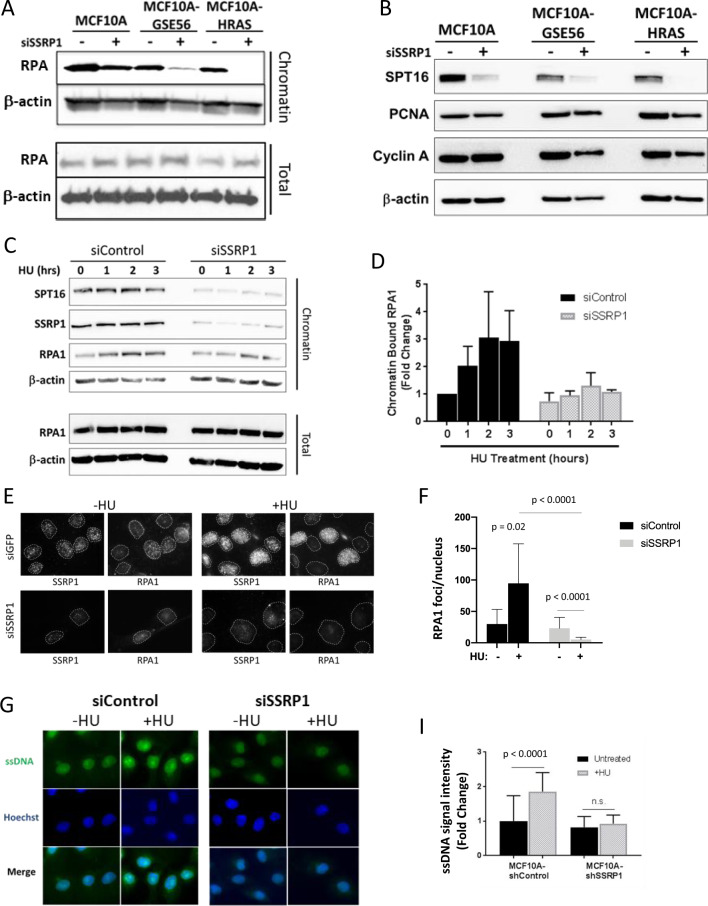
Fig. 5. ssDNA does not accumulate upon replication stress in FACT-depleted cells.
a, b Immunoblotting of total and chromatin extracts 72 h after transfection of with siSSRP1 (+) or siControl (−). c Immunoblotting of total and chromatin extracts 72 h after transfection of MCF10A cells with siSSRP1 (+) or siControl (−) and treatment with 2.5 mM HU for the indicated time points. d Quantitation of panel c. Data are presented as the mean ± SD (n = 2) for the chromatin-bound RPA1 band intensity relative to total RPA1. e, f Immunofluorescence staining of MCF10A cells following transfection with either control siRNA (siGFP) or SSRP1 siRNA and treatment with 2.5 mM HU for 6 h. Cells were permeabilized before fixation to remove soluble proteins. e Representative images of SSRP1 and RPA1 staining. The contours of cell nuclei used for quantitation are shown with the dotted lines. f Quantitation of RPA1 foci per cell. Data are presented as the mean ± SD for 20–50 cells. g–i Immunofluorescence staining of ssDNA in MCF10A cells following transfection with control (siControl) or SSRP1 siRNA and treatment with 2.5 mM HU for 3 h. g Representative images. i Quantitation of ssDNA staining per cell presented in g. Data are presented as the mean ± SD for 20–50 cells (n = 3).

