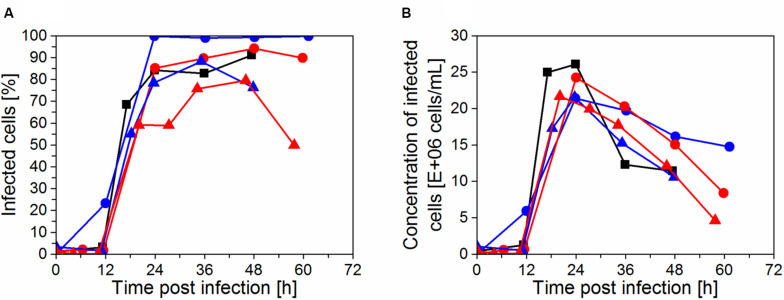
FIGURE 5.
Progression of infection of cells with influenza A virus in perfusion cultivations determined by imaging flow cytometry. (A) Fraction of infected cells positive for virus nucleoprotein and (B) concentration of infected cells in the bioreactor, calculated from the measured total cell concentration and the fraction of infected cells. Runs: IS3 ( ), IS4 (
 ), IS5 (
 ), IS6 (
 ), and ATF (
 ).
).

