Fig. 1.
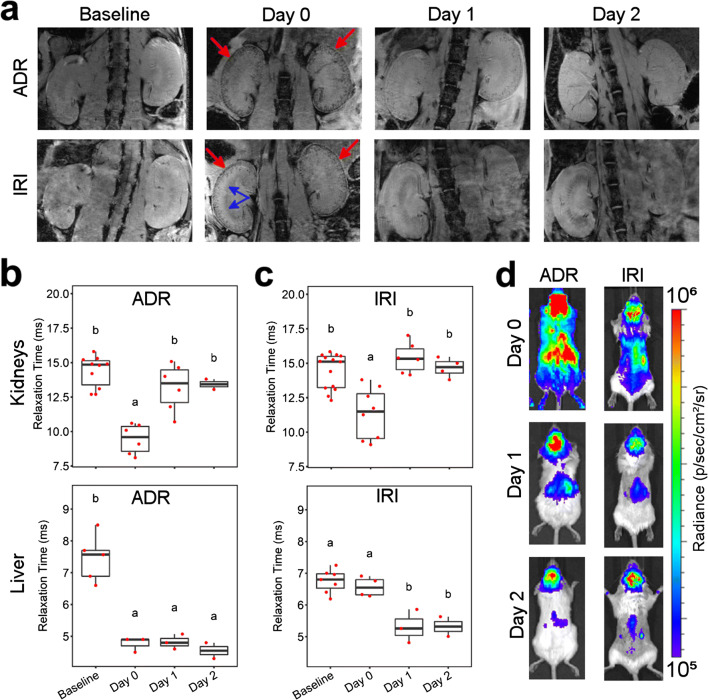
In vivo MR/BL imaging provides evidence of MSC delivery to the kidneys, but no clear differences in the presence of a kidney injury. a MRI of the kidneys at baseline (prior to injury) and up to 2 days post intracardiac administration of 106 cells to SCID mice with an adriamycin or ischaemia-reperfusion renal injury. On the cell administration day (day 0), hypointense contrast was seen in the cortices of the kidneys (red arrows), indicating cell delivery. The contrast is lost in subsequent days. In the IRI model, hypointense contrast is also seen in the medulla of the injured kidney (blue arrows). b T2* relaxation time of the kidneys’ cortices and liver in the ADR model. c T2* relaxation time of the kidneys and liver in the IRI model. Time points that do not share the same letters are significantly different from one another, p < 0.05 (Tukey’s post hoc test). p values for all comparisons are shown in SI Table 1. d BLI on cell administration day (day 0) shows whole-body distribution of cells, including the kidneys but the signal is progressively lost in subsequent days, suggesting cell death

