Fig. 5.
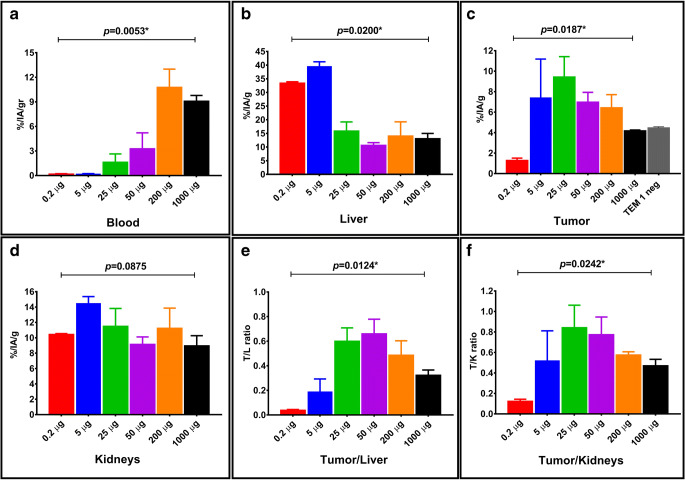
Box-plot panels detailing the biodistribution results of the dose-escalation study in RD-ES tumor-bearing mice. Upper panels show variations of 111In-CHX-DTPA-scFv78-Fc uptake in blood (panel a), liver (panel b) and tumor (panel c), respectively. Lower panels show variations of kidney uptake (panel d), tumor-to-liver (panel e) and tumor-to-kidneys (panel f) ratios, respectively. p values indicated above each panel were obtained by Kruskall-Wallis test. p values < 0.05 are marked with *.

