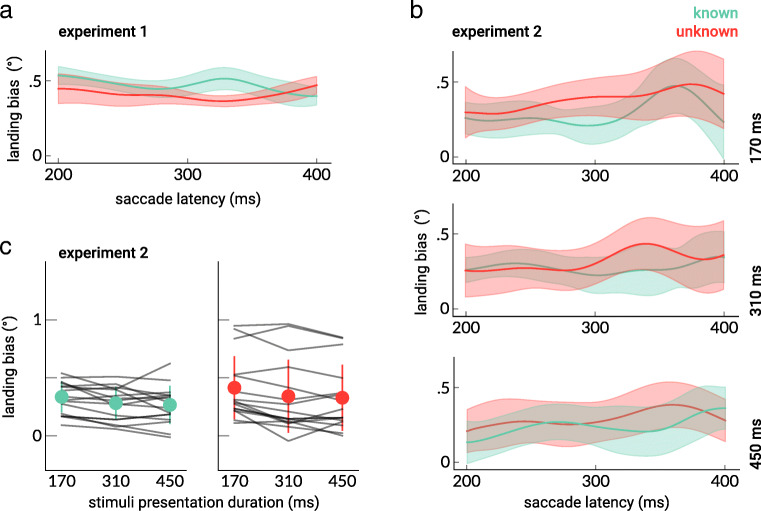
Fig. 3.
The landing bias as a function of saccade latency for Experiments 1 (a) and 2 (b), reconstructed using the SMART method. The transparent areas indicate the 95% confidence interval of the mean. c The mean landing bias in the “known” and “unknown” conditions. The landing bias was greater for the 170-ms presentation time compared with both 310 and 450-ms presentation times both in the “known” and “unknown” groups. The gray lines indicate individual subjects. The error bars represent the 95% between-participants confidence intervals. (Color figure online)

