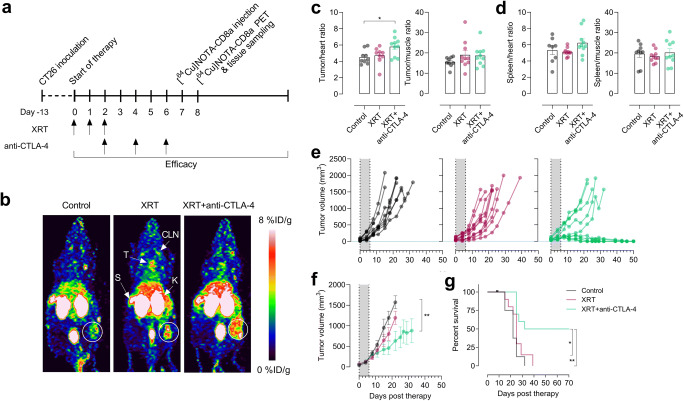
Fig. 2.
a Overview of timing of model establishment, therapy regimen, and [64Cu]NOTA-CD8a injection and scanning (N = 16/group). Radiation therapy (XRT) was performed as fractionated doses for three consecutive days (3 × 2 Gy) and anti-mouse CTLA-4 antibody was dosed i.p. at 10 mg/kg three times. b Representative maximum intensity projection PET images of a mouse from each treatment group at 24 h p.i. of [64Cu]NOTA-CD8a illustrating uptake in thymus (T), lymph nodes (cervical lymph node, CLN), spleen (S), kidneys (K), and tumors (designated by circle). c Tumor-to-heart and tumor-to-muscle ratios of [64Cu]NOTA-CD8a. d Spleen-to-heart and spleen-to-muscle ratios of [64Cu]NOTA-CD8a. e Tumor growth of individual mice in each treatment group from the time of randomization (day 0) until 1500 mm3 or end of study. The gray area represents the treatment period. f Mean tumor growth from the time of randomization (day 0) until > 50 % of mice in each treatment group was euthanized. The gray area represents the treatment period. g Survival proportions of mice in the different treatment groups. All uptake values are derived from PET ROI analysis and expressed as % ID/g. Data are presented as mean ± SEM (N = 10/group for all graphs). The significance level is indicated by asterisks (*). *p < 0.05, **p < 0.01, ***p < 0.001, ****p < 0.0001. XRT, external radiation therapy; % ID/g, % injected dose per gram tissue.

