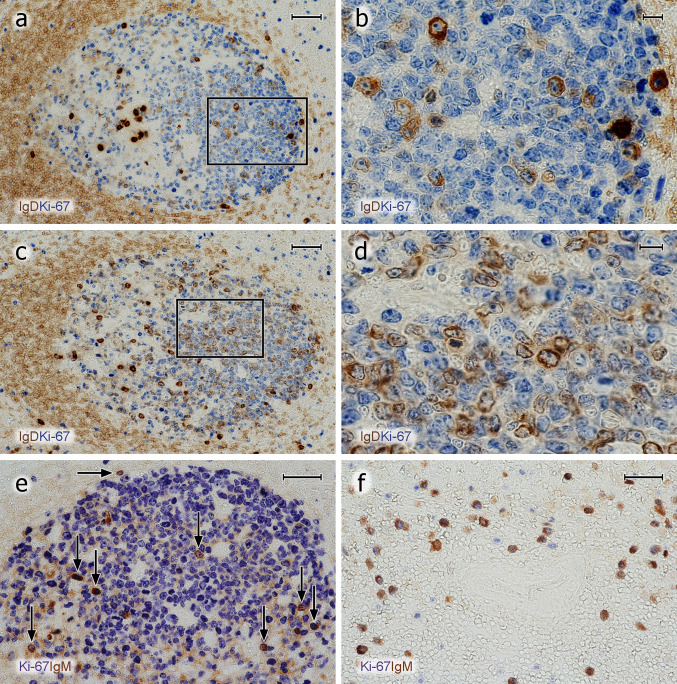
Fig. 7.
Proliferation of icIg+ cells. a–d Visualisation of IgD+ cells (polyclonal Abs, brown) followed by detection of Ki-67 (mAb MIB-5, blue). a, b There are several Ki-67+icIgD+ plasmablasts in the dark zone and Ki67−icIgD++ PCs in the basal light zone. The icIg+ cells in the dark zone do not exhibit the typical nuclear morphology of PCs. c, d In another follicle of the same individual, even more weakly IgD+ cells with Ki-67 expression are seen in the dark zone. It is impossible to distinguish intracellular and surface staining. Such GCs are infrequent. e Several dark zone Ki-67+ cells stained blue in the first step show icIgM in the second step (brown) of staining (vertical arrows). Single double-positive cells always occur at the surface of the dark zone (horizontal arrow). f In the outer T-cell region of a human spleen Ki-67 (blue) is demonstrated in about 50% of icIgM+ migratory plasmablasts (brown). The unstained structure in the centre of the image is a bending central artery. Same method as in e. The crypt epithelium is located beyond the left margin in a, c and below the bottom of the image in e. a–e 38-year-old female. f 17-year-old male. Scale bars 50 µm (a, c), 10 µm (b, d), and 40 µm (e, f)

