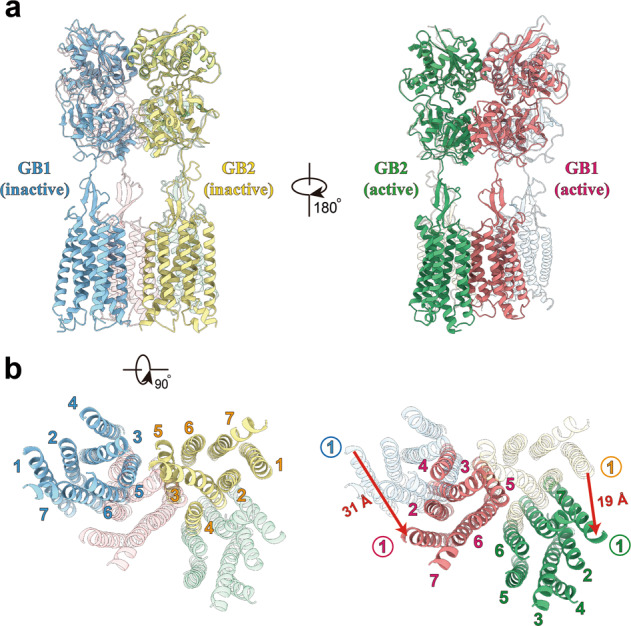
Fig. 2. Structural comparison of GABAB receptor in inactive and active states.

a, b Orthogonal views of the superimposed structures of GABAB receptor in inactive and active states, showing the domain repositioning upon agonist binding-induced activation. Side views (a) and intracellular views (b) of superposed structures are shown, with the active structure in translucent in the left panels and the inactive structure in translucent in the right panels, respectively. VFT domains and loops are omitted for clarity in b. Red arrows indicate the translation direction and distance for GB1 and GB2 (measured at extracellular tips of TM1 helices), respectively. Structures were aligned on the combined domains of GB1 VFT and GB2 lobe 1, the relatively stable parts of the receptor along activation pathway.
