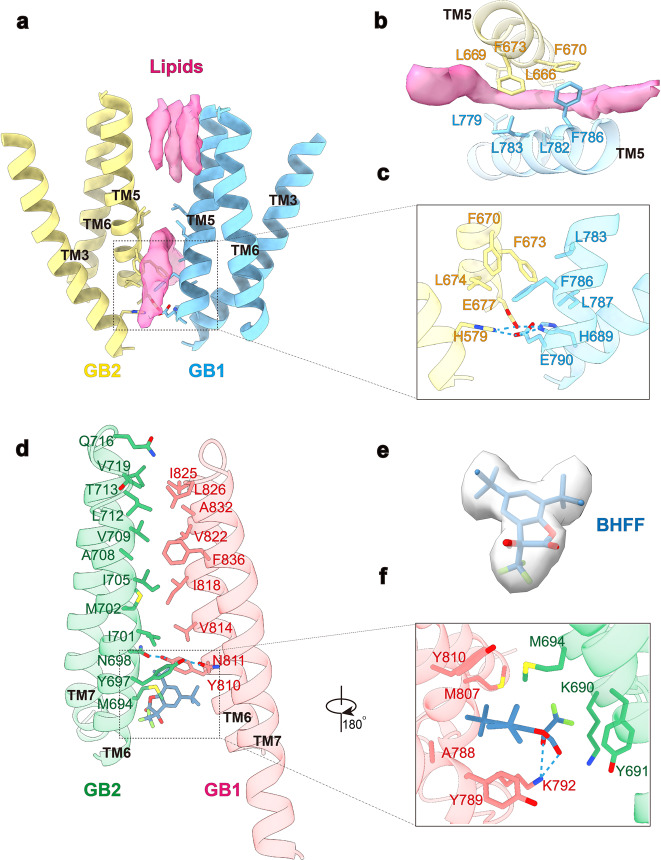
Fig. 3. Structural details of the TM heterodimeric interfaces for the inactive and active GABAB structures.
a, b Side (a) and intracellular (b) views of the inactive TM interface. EM densities (magenta) corresponding to putative cholesterols are shown in surface. c Close view of inactive TM interface proximal to the cytoplasm. H6893.55 and E7905.60 of GB1, H5793.55 and E6775.60 of GB2 forms salt bridge network to stabilize an inactive conformation. d Detailed interactions of the TM interface in the active state. e, f Cryo-EM density (e) and the detailed interactions (f) of (+)-BHFF (PAM) in the active TM interface. The critical residues are shown as sticks. Hydrogen bonds are depicted as dashed lines.

