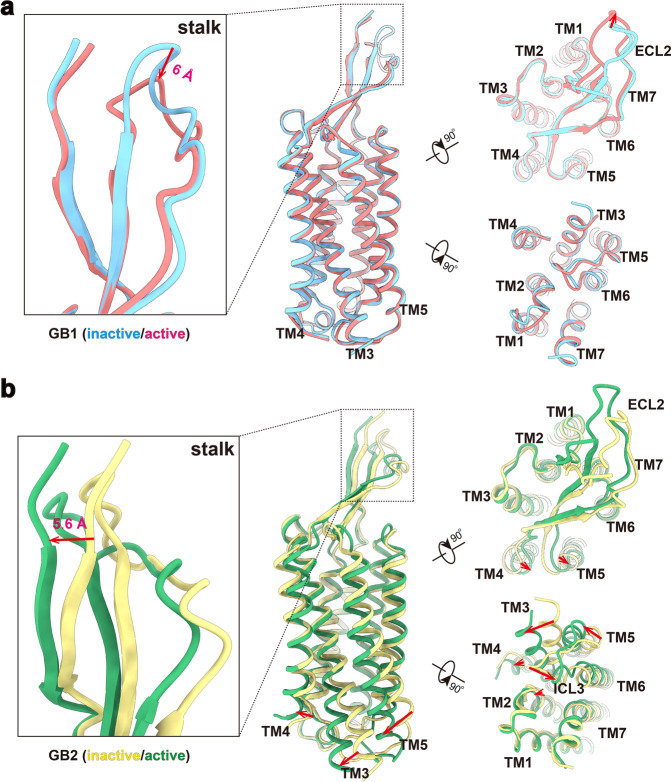
Fig. 4. Structural comparison of individual TM domains between inactive and active states.
a, b GB1 TM domain (a) and GB2 TM domain (b) between inactive and active states are superposed, respectively. Side, extracellular and intracellular views are shown. Magnified views of the stalk domains are shown in the left. Red arrows represent the movement direction and distance of TMs and loops.

