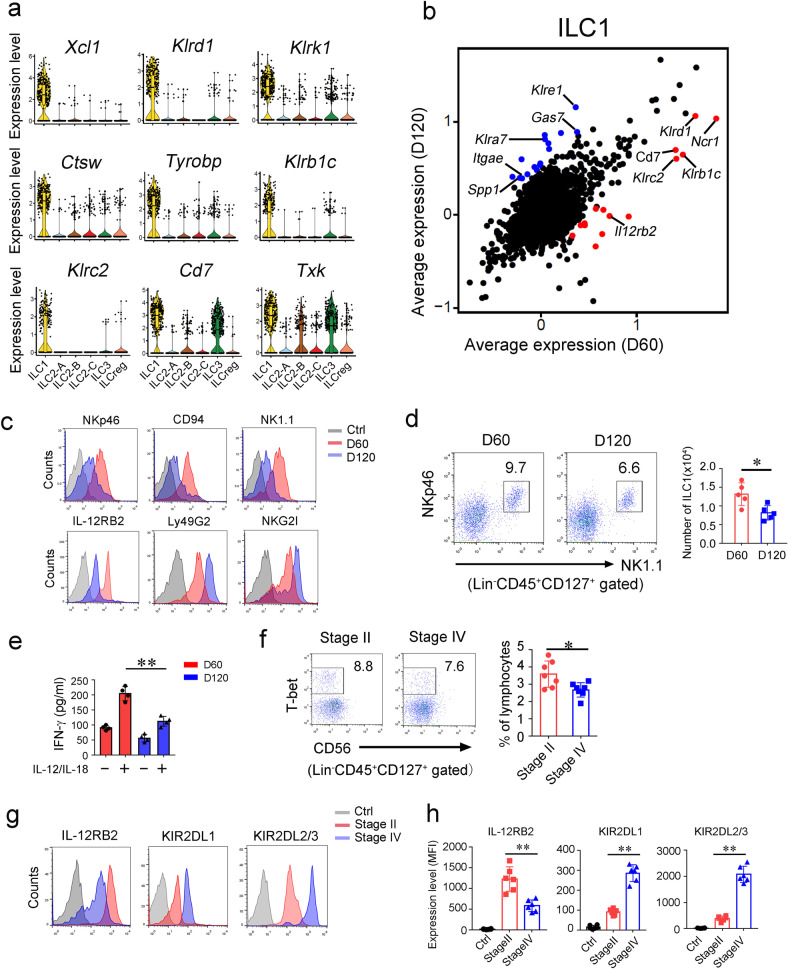
Fig. 2. ILC1s undergo functional conversion during CRC progression.
a Expression distributions of selected ILC1 signature genes were shown by violin plots. b Scatter plot displaying gene expression of ILC1s at early and late tumor stages. Scale data generated from Seurat analysis for the scatter plot. c Indicated surface markers of ILC1s were analyzed by flow cytometry. d Flow cytometry analysis of ILC1s (Lin−CD45+CD127+NK1.1+NKp46+) inside colon tumors of indicated stages. ILC1 numbers per cm3 colon tumor were calculated and shown as means ± SD (right panel). *P < 0.05 by Two-tailed unpaired Student’s t test. n = 5 for each group. e ILC1s (Lin−CD45+CD127+NK1.1+NKp46+) in tumors at indicated stages were isolated and treated with 10 ng/mL IL-12/IL-18 for 12 h. Secreted IFN-γ was analyzed by ELISA and shown as means ± SD. **P < 0.01 by Two-tailed unpaired Student’s t test. n = 4 for each group. f Tumor infiltrating ILC1s from CRC patient samples of indicated stages were analyzed by flow cytometry. The percentage of ILC1 in lymphocyte population was calculated and shown as means ± SD (right panel). *P < 0.05 by Two-tailed unpaired Student’s t test. n = 6 for each group. (human ILC1 = Lin−CD45+CD127+cKit−NKp44−CD56−Tbet+, Lin = CD2, CD3, CD14, CD16, CD19, CD56, CD235a). g, h Surface markers of ILC1s in tumors from CRC patient samples were analyzed by flow cytometry. Isotype Ig of each antibody was used as a negative control (Ctrl). Medians of fluorescence intensity (MFI) of each cell were calculated and shown as means ± SD. **P < 0.01 by One Way ANOVA. n = 6 for each group. For d–e, data are representative of at least four independent experiments. For f–h, data are representative of at least six independent experiments.

