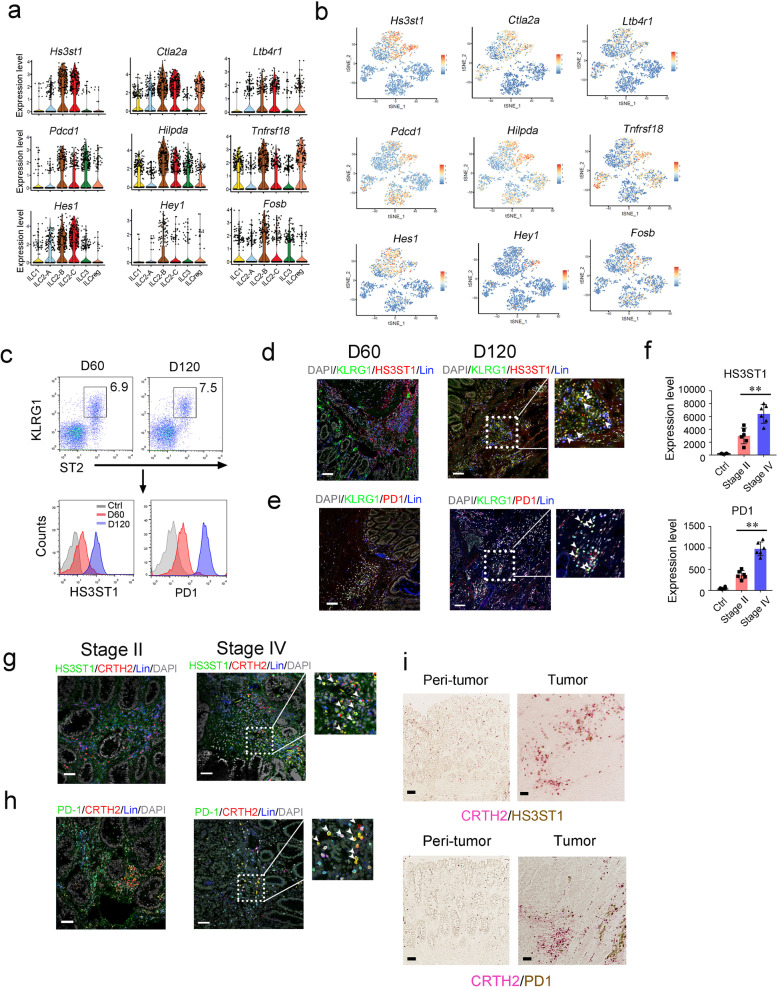
Fig. 3. Characterization of ILC2 subsets in colorectal cancer.
a Violin plots showed 9 signature genes of ILC2s during tumor progression. b Scale data derived from Seurat analysis pipeline to plot the ILC2 signature genes on a tSNE plot. c Analysis of HS3ST1 and PD1 expression in mouse tumor infiltrating ILC2s (Lin−CD45+CD127+ST2+KLRG1+) by flow cytometry. d, e Immunofluorescence staining of HS3ST1 or PD1 (red) on ILC2 cells (KLRG1+, green) of early stage tumors (D60) or late stage tumors (D120). Scale bar, 50 μm. White arrowhead indicates ILC2s. f Expression level of indicated protein on tumor infiltrating ILC2s (Lin−CD45+CD127+CRTH2+) from colorectal cancer patients were analyzed by flow cytometry. Medians of fluorescence intensity (MFI) of each cell were calculated and shown as means ± SD. **P < 0.01 by One Way ANOVA. n = 6 for each group. g, h Immunofluorescence staining of HS3ST1 or PD1 (green) of ILC2s (CRTH2+, red) from stage II or stage IV CRC patient samples. Scale bar, 50 μm. i Sections of peri-tumor and tumor tissues from stage IV CRC patients were subjected to immunohistochemistry (IHC) staining of CRTH2 (red) and HS3ST1 or PD1 (brown). Scale bar, 50 μm. For c–e, data are representative of four independent experiments. For f, data are representative of six independent experiments. For g–i, data are representative of three independent experiments.

