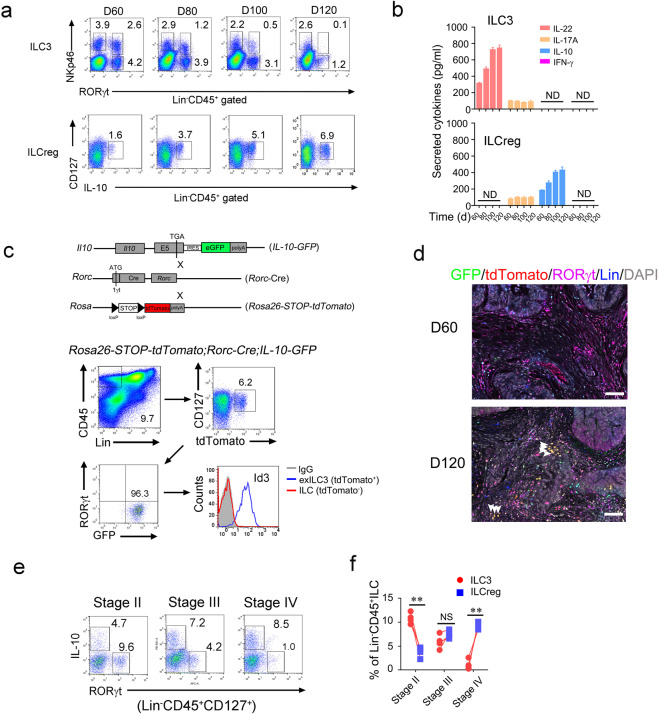
Fig. 5. Conversion of ILC3s to ILCregs during colorectal tumor progression.
a Analysis of ILC3s and ILCregs during progression of AOM/DSS-induced colorectal tumor by flow cytometry at the indicated time points. b Tumor infiltrating ILC3s (from RORγt-GFP mice) and ILCregs (from IL-10-GFP mice) were isolated for ELISA assay and secreted cytokines were shown as means ± SD. ND, not detectable. c Lineage tracing of ILC3 cells during tumor progression. Rosa26-STOP-tdTomato;Rorc-Cre;IL-10-GFP mice were treated with AOM/DSS as described previously. exILC3s (Lin−CD45+CD127+tdTomato+RORγt-) in colorectal tumor of the indicated mice were analyzed by flow cytometry. d Immunofluorescence staining of ILC3s and ILCregs in tumor section from Rosa26-STOP-tdTomato;Rorc-Cre;IL-10-GFP mice. Scale bar, 50 μm. White arrowheads denote tdTomato+ILCregs. e, f Analysis of ILC3s and ILCregs in CRC samples by flow cytometry (e). Lin−CD45+CD127+ cells were gated out for IL-10 and RORγt staining. Cell frequencies of ILCs were calculated and shown as means ± SD (f). **P < 0.01 by One Way ANOVA. NS, not significant by One Way ANOVA. n = 4 for each group. For a–d, data represent three independent experiments. For e–f, data represent four independent experiments.

