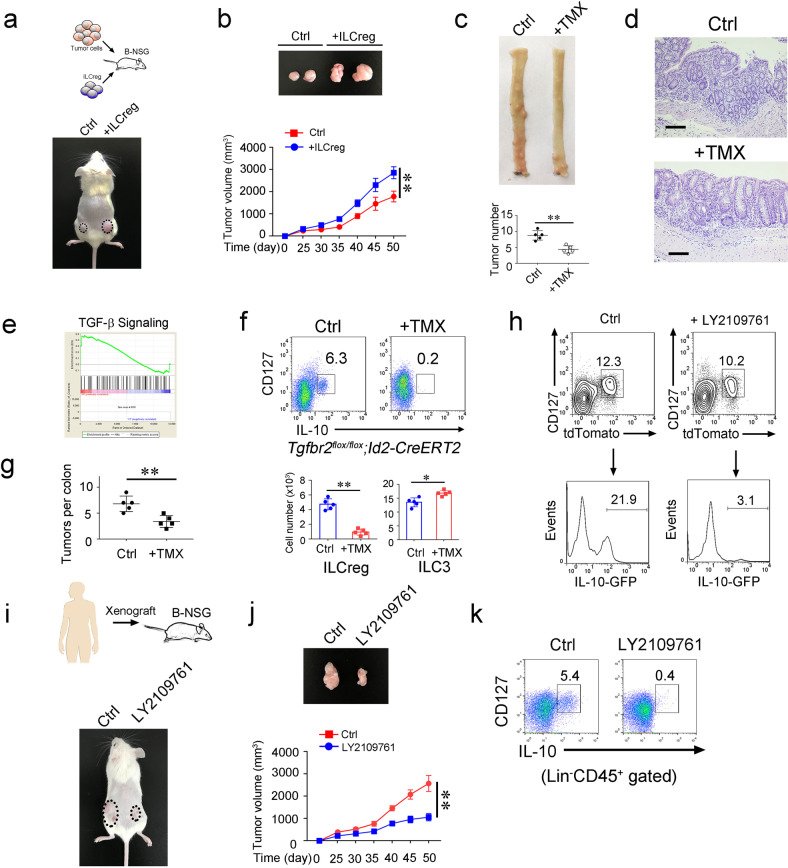
Fig. 6. ILCregs promote colorectal cancer progression.
a CT26 colon tumor cells (1 × 10⁶) and ILCregs (1 × 10⁵) sorted from AOM/DSS-induced colon tumors of IL-10-GFP mice subcutaneously injected into B-NSG mice. After 50 days, tumor photos were shown. b Tumor volumes were measured at indicated time points and calculated as means ± SD. After 50 days, tumors were isolated and shown (upper panel).**P < 0.01 by Non parametric Mann–Whitney U-test. n = 5 for each group. c Id3flox/flox;CreERT2 mice were treated with AOM/DSS as described previously. At day 60, mice were treated with TMX (50 mg/kg i.p. for six consecutive days every 20 days). Vehicle treatment served as negative control (Ctrl). At day 120, colon from indicated mice were isolated and cut open longitudinally. Colon tumor photo was shown in upper panel. Tumor numbers were calculated and shown as means ± SD. **P < 0.01 Two-tailed unpaired Student’s t test. n = 5 for each group. d H&E staining of colon from indicated mice treated as in (c). Scale bar, 50 μm. e Gene set enrichment analysis (GSEA) comparing TGF-β signaling of ILCreg and ILC3 subsets. NES (Normalized Enrichment Score) = 1.67, Nominal p = 0.00. f, g Tgfbr2flox/flox;Id2-CreERT2 mice were subjected to AOM/DSS treatment. After 60 days, mice were i.p. injected with TMX. Tumor infiltrating ILCreg and ILC3 cells were assessed by flow cytometry. Cell numbers of ILCregs and ILC3s were calculated and shown as means ± SD (f). Tumor numbers per colon were calculated and shown as means ± SD (g). *P < 0.05; **P < 0.01 by Two-tailed unpaired Student’s t test. n = 5 for each group. h tdTomato+ ILC3s from Rosa26-STOP-tdTomato;Rorc-Cre;IL-10-GFP mice were isolated and treated with 10 ng/mL TGF-β in complete cell culture in the presence or absence of 2 μM TGF-β inhibitor LY2109761. After 7 days, cells were analyzed by flow cytometry. i Human colon tumor xenografts were subcutaneously injected into B-NSG mice. After 25 days, LY2109761 was injected into xenograft tumors. 50 days after xenograft engraftment, tumors on mice were shown in the lower panel. j Xenograft tumor volumes were measured at the indicated time points and calculated as means ± SD. **P < 0.01 by Non parametric Mann–Whitney U-test. Tumors at day 50 were isolated and shown in the upper panel. n = 6 for each group. k Analysis of ILCregs (Lin−CD45+CD127+IL-10+) (Lin = CD2,CD3,CD14,CD16,CD19,CD56,CD235a) in xenograft tumors by flow cytometry. For a and b, data are representative of three independent experiments. For c–h, data are representative of five independent experiments. For i–k, data are representative of four independent experiments.

