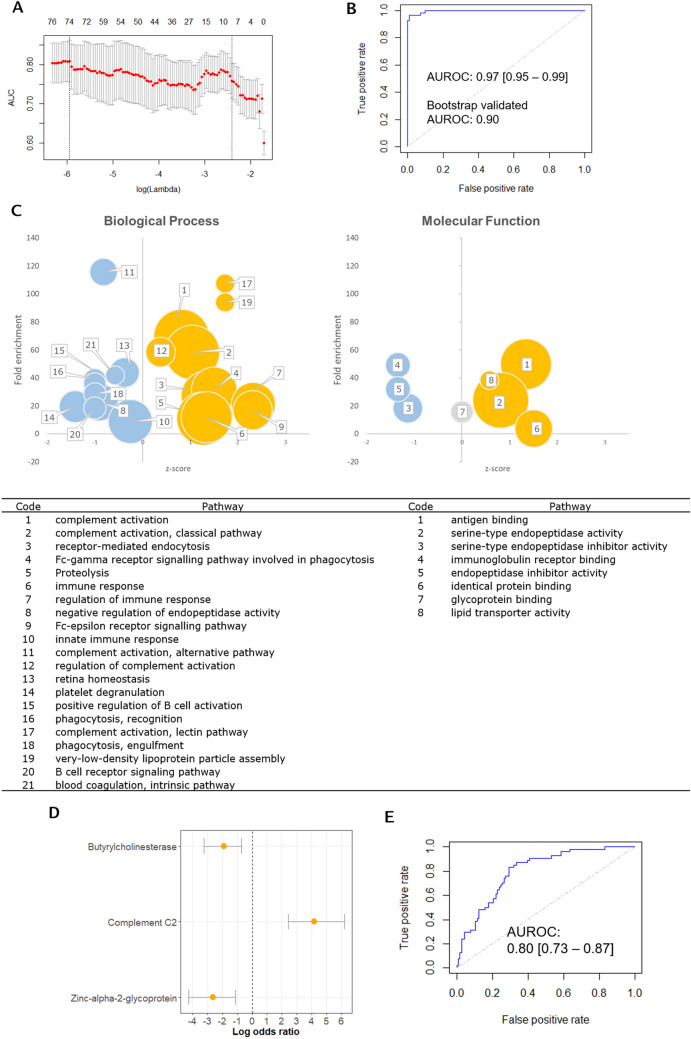
Figure 2.
Multivariate analysis of plasma proteome associated with HIV. (A) Elastic net (EN) regularized regression lambda parameter optimization curve, optimal lambda parameter was chosen based on the highest area under the receiver operator curve (AUROC); (B) AUROC (0.97 [95% CI 0.95–0.99]) of the EN model generated using the lambda parameter, alpha parameter was set to 0.75, final model extracted 34 protein features, optimism-adjusted bootstrap validation of the generated EN model, validated AUROC = 0.90 [95% CI 0.90–0.90] using 2000 iterations; (C) Gene entology (GO-terms) enrichment analysis of proteins extracted by the EN model. X-axis represents z-scores; y-axis, fold enrichment, and size of the spheres represent the number of proteins involved in the particular pathway. Gold circles represent pathways enriched in HIV(+) whereas blue circles are pathways more associated with HIV(−). The grey circle indicate that there are as much proteins in this pathway that are significantly upregulated and downregulated in HIV. Only significantly enriched pathways (p < 0.05 after FDR adjustment) are plotted. See main text for explanation of the plots. Pathways enriched are identified in the table. (D) Log odds ratio plot of the three proteins extracted after bootstrap validation with log odds on the x-axis and bars indicating 95% confidence interval obtained using weighted logistic regression with HIV as outcome variable and the three proteins as covariates. Weights used were obtained by inverse probability of treatment weights; (E) predictive ability of the weighted logistic regression model using the three bootstrap validated proteins with HIV as outcome variable, AUROC = 0.80 [95% CI 0.73–0.87].

