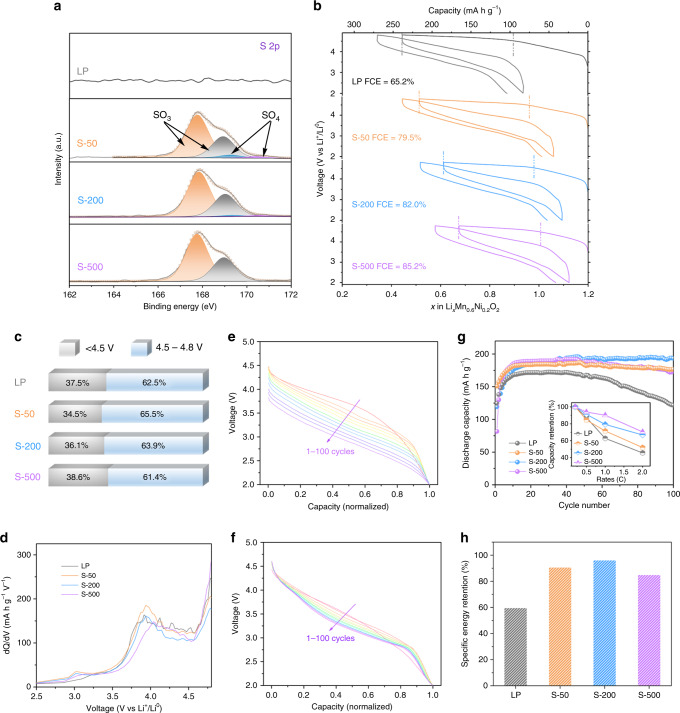
Fig. 5. The surface states and electrochemical behavior of products before and after S deposition.
a S 2p spectra of products before and after S deposition. b Voltage profiles of the first two cycles obtained at 0.5 C. Regions from 4.5 to 4.8 V are marked with vertical dash lines. c Percentage-stacked bar chart of charge capacities in the first cycle obtained at 0.5 C; the total capacities are divided into two sections: <4.5 V and 4.5–4.8 V. d dQ/dV curves of the charge process in the second cycle obtained at 0.5 C. e Normalized galvanostatic discharge profiles of LP obtained at 1 C. f Normalized galvanostatic discharge profiles of S-200 obtained at 1 C. g Cyclic performance at 1 C together with the capacity retention at different rates (insets). h Specific energy-density retention after 100 cycles at 1 C.

