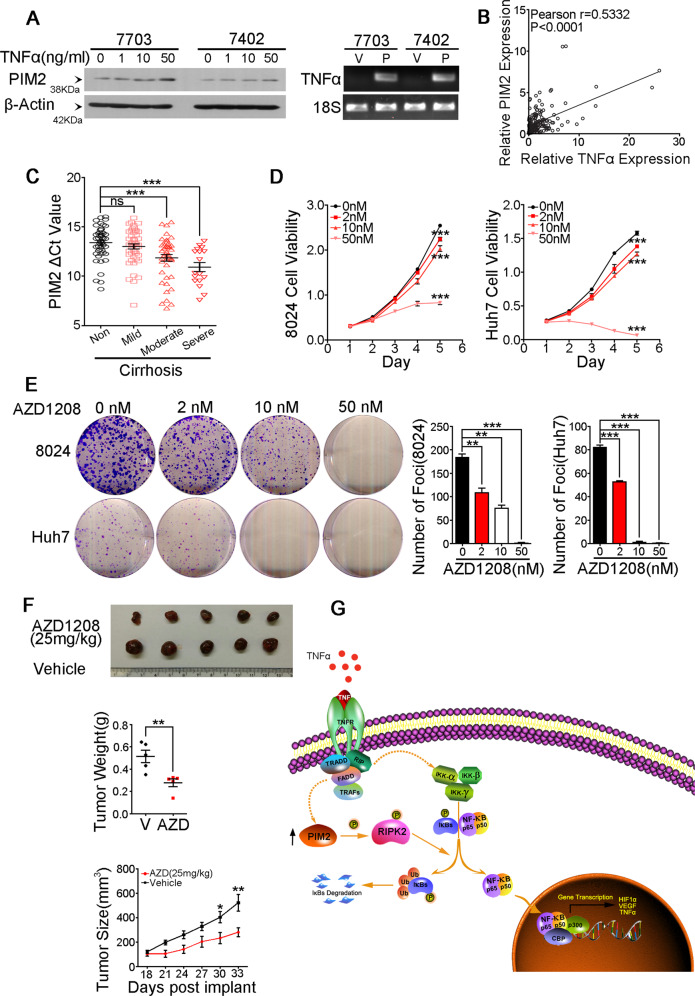
Fig. 6. A positive-feedback loop between PIM2 and TNFα.
a The expression of PIM2 in different concentration of TNFα treated HCC cells detected by Western Blot, β-Actin served as an internal control. Expression of TNFα in empty vector-transduced and PIM2-transduced HCC cells detected by semiquantitative RT-PCR. V represents empty vector-transduced group and P represents PIM2-transduced group. b Relative expression level of PIM2 and TNFα was detected in 92 pairs of HCC tumor and nontumor samples by qRT-PCR. c Average ΔCt value of PIM2 in HCC patients without cirrhosis and with different degree of cirrhosis. ***p < 0.001, independent Student’s t test. d AZD1208 treatment decreased growth rates of 8024 and Huh7 cells. ***p < 0.001, independent Student’s t test. e AZD1208 treatment decreased PLC8024 and Huh7’s ability to form foci in monolayer culture in a dose dependent manner. **p < 0.01, ***p < 0.001, independent Student’s t test. f Eighteen days after injection of PLC8024 cells in nude mice, oral administration of 25 mg/kg AZD1208 or vehicle control once 2 days was performed, tumors were monitored once every three days for total 15 days. n = 5 per group, *p < 0.05, **p < 0.01, independent Student’s t test. g A schematic diagram illustrating the proposed TNFα/PIM2/NF-κB Signaling Axis in HCC progression.

