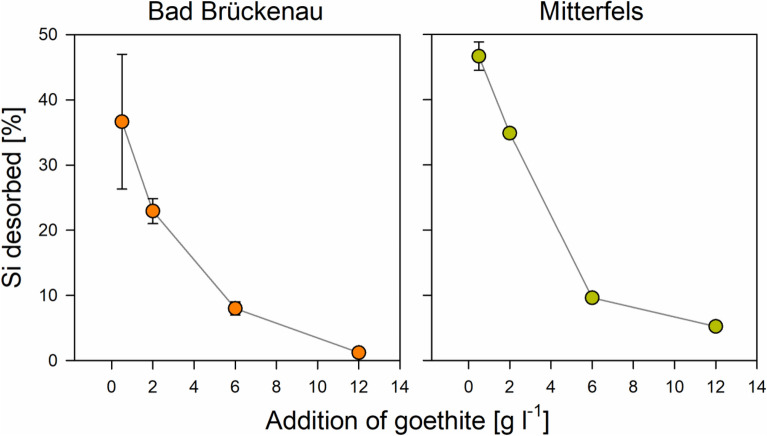
Figure 5.
Percentage of Si desorbed from the goethite surfaces with high Si pre-loading due to interactions with the two forest floor solutions as a function of the goethite amounts added (data for other Si-preloading levels are not shown because less pronounced or no desorption occurred); the error bars indicate the standard deviation for experimental replicates. Data were plotted using SigmaPlot 11.0 from Systat Software, San Jose, CA.

