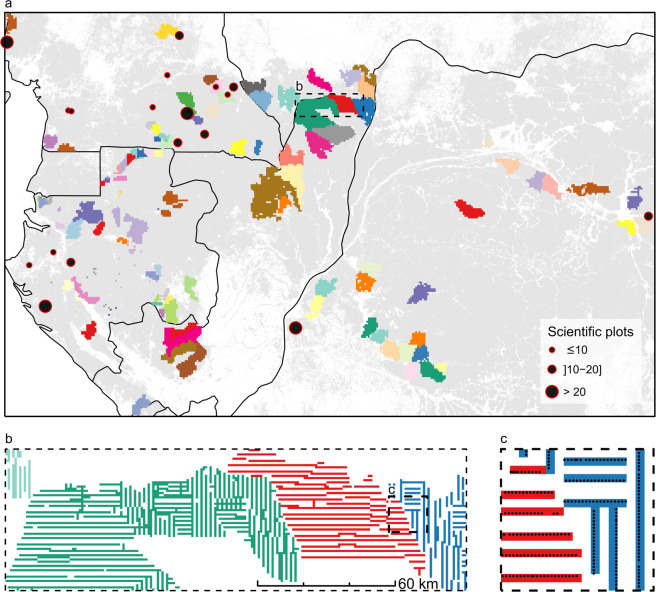
Fig. 2.
Spatial distribution of forest inventory data in managed concessions of central Africa. (a) Inventory data are colored by logging concessions and aggregated into 5-km pixels (for visual purpose). Black dots represent the location of scientific plots used to evaluate the biomass computation scheme, with dots’ size corresponding to the number of plots per sampling site. Forestry data is underlaid by the spatial distribution of moist forests21 (light grey) and national limits (black). Outlined region is expanded in b. (b) Selected subset of forest management inventory data colored by logging concessions and displayed at the actual scale of CoFor-AGB, i.e. 1 km. Outlined region is expanded in c. (c) Forest management inventory plots (black dots) along inventory transects, underlaid by the 1-km pixel grid used to aggregate inventory data and compute forest biomass.

