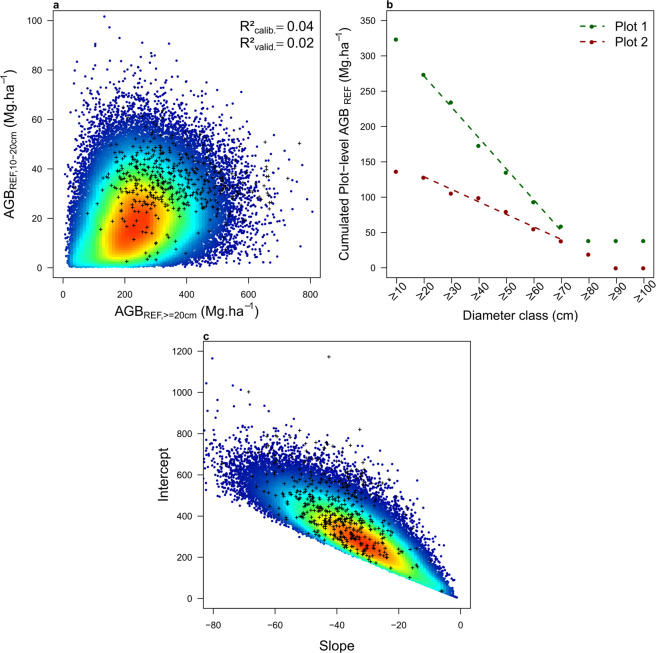
Fig. 5.
Biomass correction model for trees in diameter class 10–20 cm. (a) Heat plot showing the relationship between tree AGB in the 10–20 cm diameter class vs AGB of trees ≥ 20 cm diameter in commercial inventories, overlaid by the scientific dataset (small black crosses). (b) Shape of the cumulated AGB distribution across 10 cm wide diameter bins for two illustrative plots, with dashed lines representing the fit of the linear models of slope S and intercept I. (c) Heat plot showing the relationship between S and I in commercial inventories, overlaid by the scientific dataset (small black crosses).

